Chesapeake Reports Q1 2016
Chesapeake Energy Corporation (ticker: CHK) reported its Q1 financial and operational results. Highlights follow:
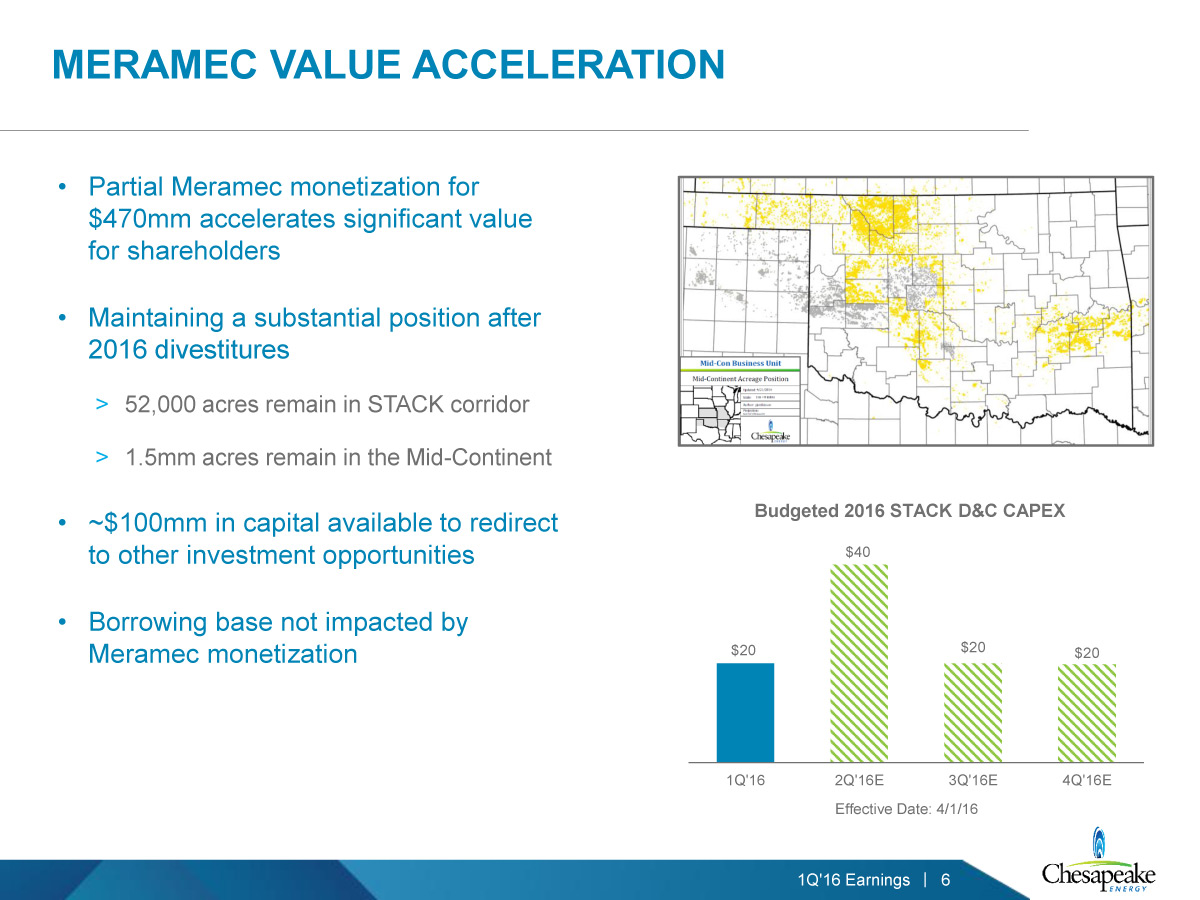
- Signed agreement to sell approximately 42,000 net acres prospective for the STACK play in Oklahoma for approximately $470 million; includes current production of 3,800 BOE per day
- 2016 first quarter production averaged approximately 672,400 BOE per day, an increase of 1% year over year, adjusted for asset sales
- Improved 2016 first quarter cost performance leads to lower full-year 2016 production expense and GP&T expense guidance
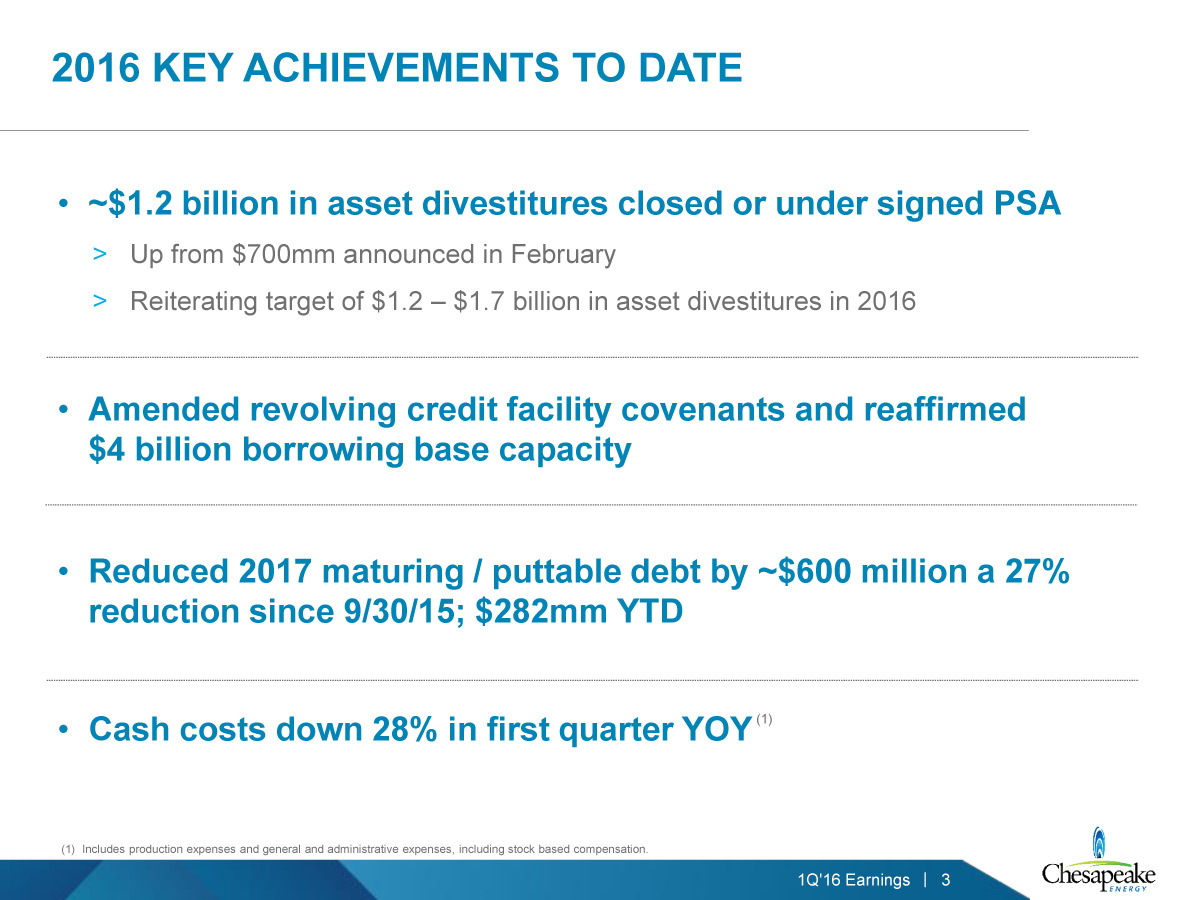
- Financial strategy remains focused on maximizing liquidity and liability management; company reiterates target of $1.2 to $1.7 billion total gross proceeds from asset divestitures by year-end
- Net loss available to common stockholders of $964 million, or $1.44 per fully diluted share
- Noncash impairment of the carrying value of Chesapeake’s oil and natural gas properties of approximately $853 million, largely resulting from decreases in the trailing 12-month average first-day-of-the-month oil and natural gas prices as of March 31, 2016, compared to December 31, 2015
- First quarter revenues declined by 39% year over year, primarily due to a decrease in the average realized commodity prices received for its production
- Average daily production for the 2016 first quarter of approximately 672,400 barrels of oil equivalent (boe) increased 1%, adjusted for asset sales, and consisted of approximately 95,700 barrels (bbls) of oil, 3.036 billion cubic feet (bcf) of natural gas and 70,700 bbls of natural gas liquids (NGL)
- Average production expenses during the 2016 first quarter were $3.36 per BOE, a decrease of 31% from the 2015 first quarter.
- G&A expenses (including stock-based compensation) during the 2016 first quarter were $0.79 per BOE, a decrease of 13% from the 2015 first quarter.
STACK Sale Announced
“We are pleased this morning to announce approximately $500 million of incremental asset sales above the $700 million we announced in late February. The STACK acreage sale we are announcing today accelerates value from a portion of our undeveloped acreage that currently generates very little cash flow, giving us the ability to enhance current liquidity,” Chesapeake CEO Doug Lawler said in a press release.
“This transaction contributes substantially to achieving our previously announced target of an incremental $500 million to $1 billion of asset sales by year-end. We anticipate subsequent divestitures during the second and third quarters.
“Since January 1, 2016, we have reduced debt that matures or can be put to us in 2017 by approximately $282 million. Our recently amended revolving credit facility agreement gives us sufficient liquidity and capacity to pursue additional reductions of our near-term maturities as opportunities arise.”
Asset Divestitures Update
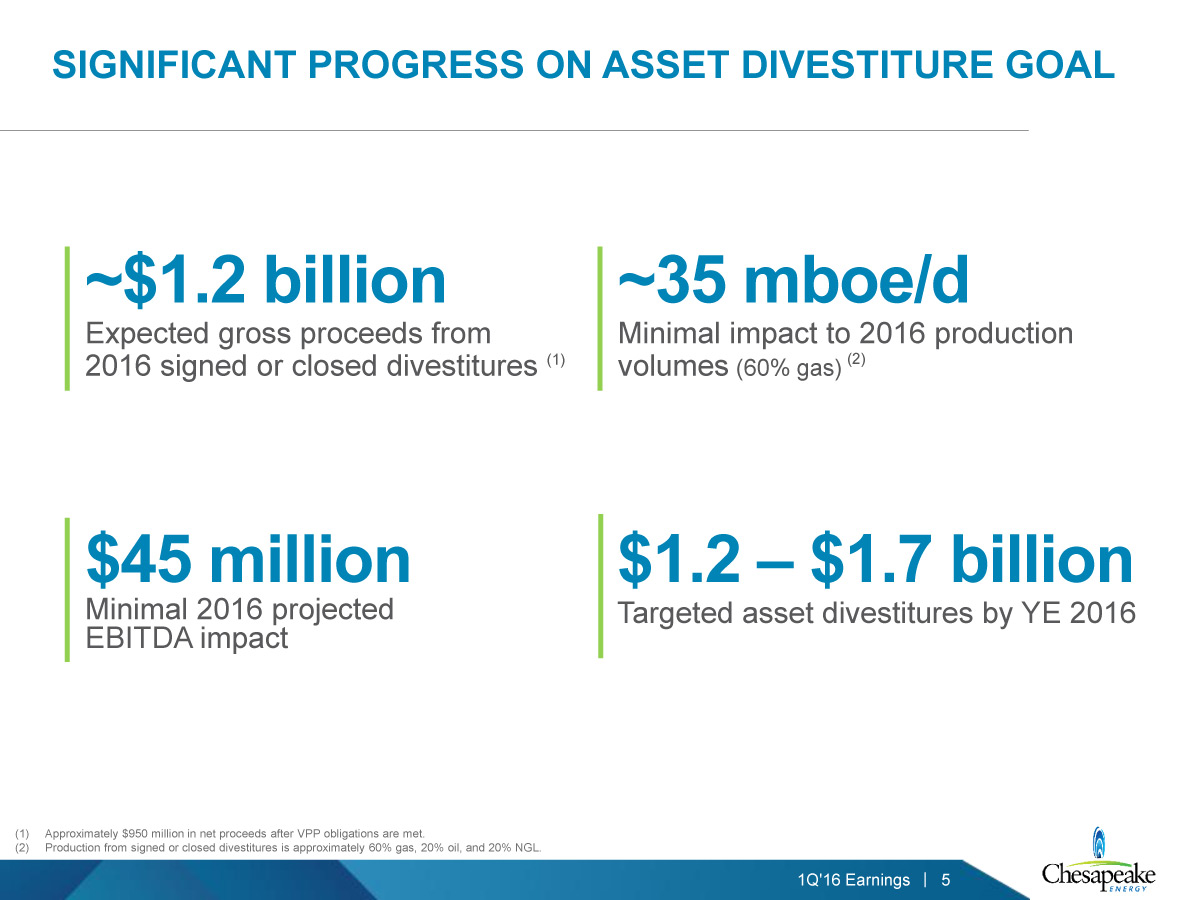
In 2016, Chesapeake has closed or has under signed sales agreements approximately $1.2 billion in gross proceeds from asset divestitures, or approximately $950 million in net proceeds after certain related repurchases of Volumetric Production Payment (VPP) obligations are met.
Transactions signed since February 2016 include the sale of a portion of the company’s acreage and producing properties in its STACK play in northern Oklahoma for approximately $470 million to Newfield Exploration Company (NYSE: NFX).
Included in the sale are approximately 42,000 net acres and 400 producing wells which are currently producing 3,800 BOE per day (approximately 55% liquids), net to Chesapeake.
Substantially all of the company’s announced asset divestitures are expected to close by the end of the third quarter. For the expected $950 million in net proceeds currently closed or signed in 2016, the net impact to the company’s production is projected to be a reduction of approximately 35,000 BOE per day (approximately 60% natural gas).
In the Q1 conference call, the company responded to questions about the STACK sale and the overall divestiture target for the year.
Q: Doug, your thoughts, reasoning for, I’m wondering on the piece you did sell and the piece you kept, is it just positioning as far as – any I guess color you can add on sort of the piece you sold versus why you kept the other piece?
CHK: We really like the STACK. We’ve talked about it in the past, and we feel very confident in our position. This transaction with Newfield we think is mutually beneficial to both companies. We still have approximately half of our STACK acreage in the play with other significant opportunities, as noted in the past, in particular like the Oswego that we still really like and are encouraged by.
What we know here is that this position, for Chesapeake, the amount of funding that we’re going to put towards it in the near term and the value acceleration opportunity was just compelling for us at this point in time. And so bringing those proceeds in versus investing the capital over a multi-year period for Chesapeake, it was in our best interest to divest the property.
So as we evaluate other assets, the non-core areas that in many cases are non-operated properties, we’ll continue to look for those to continue to apply proceeds towards our capital structure or other corporate investments. So I think it was a good thing for the company and a mutually beneficial transaction.
Q: Doug, are you saying that mostly further sales, to get to that $1.2 billion or so, or I guess you’re already there, but beyond that would be more likely to be more non-core? I’m just wondering if things like parts of the Eagle Ford or parts of the Utica, which obviously are great asset positions, I mean how do you view things like that or are you just looking at more non-core sales going forward?
CHK: At this point in time, it’s really more non-core that we’re looking at. And just highlight that in February, Neal, we said $500 million to $1 billion for the remainder of the year. Having accomplished the lower end of that range, we’ll continue to look for those incremental non-core sales that are not going to materially impact our production or our EBITDA position.
Capital Spending Overview
Chesapeake’s total capital investments were approximately $365 million during the 2016 first quarter, compared to approximately $1.5 billion in the 2015 first quarter, as summarized in the table below.
| 2016 | 2015 | 2015 | ||||
| Activity Comparison | Q1 | Q4 | Q1 | |||
| Average operated rig count | 8 | 14 | 54 | |||
| Gross wells completed | 57 | 85 | 261 | |||
| Gross wells spud | 41 | 66 | 244 | |||
| Gross wells connected | 80 | 100 | 262 | |||
| Type of Cost ($ in millions) | ||||||
| Drilling and completion costs | $ | 281 | $ | 405 | $ | 1,300 |
| Exploration costs and additions to other PP&E | 16 | 55 | 63 | |||
| Subtotal capital expenditures | $ | 297 | $ | 460 | $ | 1,363 |
| Capitalized interest | 68 | 88 | 123 | |||
| Total capital expenditures | $ | 365 | $ | 548 | $ | 1,486 |
Balance Sheet and Liquidity
As of March 31, 2016, Chesapeake’s debt principal balance was approximately $9.4 billion, including approximately $367 million of borrowings outstanding on the company’s $4.0 billion revolving credit facility, compared to $9.7 billion as of December 31, 2015, and $11.5 billion as of March 31, 2015. Since January 1, 2016, the company retired its 3.25% Senior Notes due March 15, 2016, and has repurchased or exchanged approximately $282 million of debt due or putable in 2017 at an average discount of approximately 39%.
In April, Chesapeake amended its $4.0 billion revolving credit facility maturing in 2019 to reaffirm its borrowing base, restructure financial covenants and increase its ability to issue secured debt. Under the new amendment, Chesapeake agreed to pledge additional assets as collateral. As part of the amendment, the next scheduled borrowing base redetermination review has been postponed until June 2017. Letters of credit issued under the credit facility were approximately $619 million as of March 31, 2016, which included a $461 million supersedeas bond supporting the company’s appeal of the judgment issued in 2015 with respect to the company’s 2019 Notes litigation.
Key Financial and Operational Results
The table below summarizes Chesapeake’s key financial and operational results during the 2016 first quarter as compared to results in prior periods.
| Three Months Ended | |||||||||
| 03/31/16 | 12/31/15 | 03/31/15 | |||||||
| Oil equivalent production (in mmboe) | 61 | 61 | 62 | ||||||
| Oil production (in mmbbls) | 9 | 9 | 11 | ||||||
| Average realized oil price ($/bbl)(a) | 37.74 | 64.04 | 65.73 | ||||||
| Natural gas production (in bcf) | 276 | 268 | 264 | ||||||
| Average realized natural gas price ($/mcf)(a) | 2.29 | 2.35 | 3.67 | ||||||
| NGL production (in mmbbls) | 6 | 7 | 7 | ||||||
| Average realized NGL price ($/bbl)(a) | 11.44 | 14.07 | 18.40 | ||||||
| Production expenses ($/boe) | (3.36) | (3.62) | (4.84) | ||||||
| Gathering, processing and transportation expenses ($/boe) | (7.88) | (11.34) | (7.40) | ||||||
| Production taxes ($/boe) | (0.30) | (0.19) | (0.45) | ||||||
| General and administrative expenses ($/boe)(b) | (0.66) | (0.84) | (0.72) | ||||||
| Stock-based compensation ($/boe) | (0.13) | (0.18) | (0.19) | ||||||
| DD&A of oil and natural gas properties ($/boe) | (4.43) | (5.37) | (11.08) | ||||||
| DD&A of other assets ($/boe) | (0.48) | (0.50) | (0.57) | ||||||
| Interest expenses ($/boe)(a) | (0.98) | (1.70) | (0.98) | ||||||
| Marketing, gathering and compression net margin ($ in millions)(c) | 18 | 2 | (25) | ||||||
| Operating cash flow ($ in millions)(d) | 263 | 386 | 882 | ||||||
| Operating cash flow ($/boe) | 4.29 | 6.35 | 14.29 | ||||||
| Adjusted ebitda ($ in millions)(e) | 282 | 298 | 928 | ||||||
| Adjusted ebitda ($/boe) | 4.61 | 4.90 | 15.02 | ||||||
| Net loss available to common stockholders ($ in millions) | (964) | (2,228) | (3,782) | ||||||
| Earnings (loss) per share – diluted ($) | (1.44) | (3.36) | (5.72) | ||||||
| Adjusted net income (loss) available to common stockholders ($ in millions)(f) | (120) | (168) | 42 | ||||||
| Adjusted earnings (loss) per share – diluted ($) | (0.10) | (0.16) | 0.11 | ||||||
| (a) | Includes the effects of realized gains (losses) from hedging, but excludes the effects of unrealized gains (losses) from hedging. | ||||||||
| (b) | Excludes expenses associated with stock-based compensation and restructuring and other termination costs. | ||||||||
| (c) | Includes revenue, operating expenses and $20 million, $5 million and a nominal amount of unrealized gains on supply contract derivatives for the three months ended March 31, 2016, December 31, 2015 and March 31, 2015, respectively. Excludes depreciation and amortization of other assets. | ||||||||
| (d) | Defined as cash flow provided by operating activities before changes in assets and liabilities. | ||||||||
| (e) | Defined as net income before interest expense, income taxes and depreciation, depletion and amortization expense, as adjusted to remove the effects of certain items detailed on page 12. | ||||||||
| (f) | Defined as net income available to common stockholders, as adjusted to remove the effects of certain items detailed on page 10. | ||||||||
Read a transcript of the Chesapeake Energy Q1 Conference Call.
Read the Q1 Press Release.
View the Chesapeake Q1 Investor Presentation.
