EIA releases new maps detailing the structure of the Marcellus Shale
The Energy Information Administration (EIA) today released updated geologic maps of the Marcellus formation. Well data was used to construct maps showing the formation, extent and structure of the productive and prospectively productive regions of the Marcellus.
Natural gas production from the Marcellus shale formation in the Appalachian basin increased to 16.7 Bcf/d in March 2015, accounting for more than 36% of shale gas production and more than 18% of total dry natural gas production in the United State. The EIA’s updated maps and geological information help to give a new understanding of one of America’s most prolific natural gas plays.
To generate formation structure and thickness (isopach) maps, EIA uses stratigraphic correlations provided by state geological survey agencies based on data from 2,416 wells. The Marcellus currently produces in four states: Pennsylvania, West Virginia, Ohio and New York, but because of recent bans on hydraulic fracturing in New York, information is from wells drilled prior to 2010. 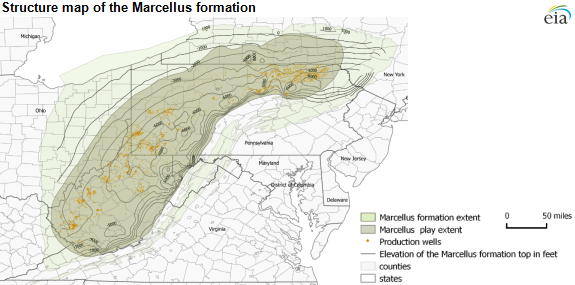
The formation’s and play’s footprints cover about 95,000 square miles and 72,000 square miles respectively. The Marcellus formation consists of several sublayers that are grouped in the Lower and Upper Marcellus intervals. The Lower Marcellus has a significantly higher organic matter concentration compared with the Upper Marcellus.
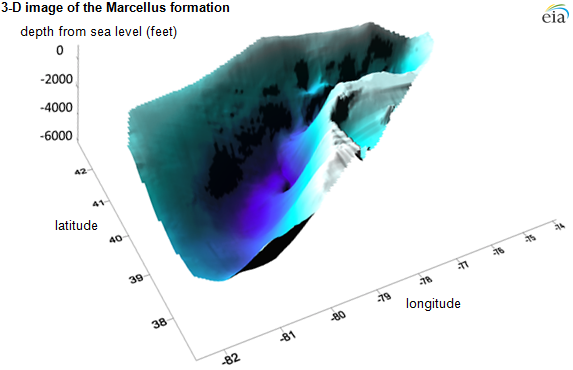
The top of the Marcellus formation ranges in elevation from 1,000 to 8,000 feet below sea level (or about 100 to 9,900 feet below the surface). The Appalachian basin is an asymmetric depression. The depth of the Marcellus formation increases gradually from northwest to southeast with an abrupt uplift along the western edge of the Appalachian Mountains. Most of the producing wells are located in areas where the subsea depth of the formation is 2,000 feet to 6,000 feet below sea level.
The Marcellus range is up to 950 feet thick and generally shows a decrease in thickness westward from the central part of the basin and pinches out in the subsurface along its eastern limit. The thick, potentially natural gas-rich interval extends southwest in an arc through New York, Pennsylvania, and West Virginia and runs parallel to the western edge of the Appalachian Mountains. Most of the current production is located in areas where formation thickness is greater than 50 feet.
Important disclosures: The information provided herein is believed to be reliable; however, EnerCom, Inc. makes no representation or warranty as to its completeness or accuracy. EnerCom’s conclusions are based upon information gathered from sources deemed to be reliable. This note is not intended as an offer or solicitation for the purchase or sale of any security or financial instrument of any company mentioned in this note. This note was prepared for general circulation and does not provide investment recommendations specific to individual investors. All readers of the note must make their own investment decisions based upon their specific investment objectives and financial situation utilizing their own financial advisors as they deem necessary. Investors should consider a company’s entire financial and operational structure in making any investment decisions. Past performance of any company discussed in this note should not be taken as an indication or guarantee of future results. EnerCom is a multi-disciplined management consulting services firm that regularly intends to seek business, or currently may be undertaking business, with companies covered on Oil & Gas 360®, and thereby seeks to receive compensation from these companies for its services. In addition, EnerCom, or its principals or employees, may have an economic interest in any of these companies. As a result, readers of EnerCom’s Oil & Gas 360® should be aware that the firm may have a conflict of interest that could affect the objectivity of this note. The company or companies covered in this note did not review the note prior to publication. EnerCom, or its principals or employees, may have an economic interest in any of the companies covered in this report or on Oil & Gas 360®. As a result, readers of EnerCom’s reports or Oil & Gas 360® should be aware that the firm may have a conflict of interest that could affect the objectivity of this report.
