EnerCom, Inc. compiled second quarter earnings per share, revenue, EBITDA and cash flow per share analyst consensus estimates on 201 E&P and OilService companies in our database.
Click here for the full chart of estimates.
The median OilServices company earnings estimate for the quarter ending June 30, 2016, is ($0.13) per share compared to actual earnings per share of ($0.11) and ($0.41) for Q1’16 and Q4’15, respectively. The median E&P company earnings estimate for the quarter ending June 30, 2016, is ($0.10) per share compared to actual earnings per share of ($0.35) and ($0.83) for Q1’16 and Q4’15, respectively.
Energy Commodities
Crude Oil. U.S. oil consumption in April 2016, was 19.3 MMBOPD, down 1.8% compared to the prior month but 1.2% higher than the same month last year. For April 2016, U.S. crude oil production was 8.9 MMBOPD, down 2.4% compared to the prior month and 7.9% lower than the same month last year. The average near-term futures price for WTI in June 2016, was $48.85 per barrel, up 4.6% from the prior month but 18.4% lower than the same month last year. The five-year strip at July 7, 2016 was $52.61 per barrel.
The average price of gasoline (all grades, all formulations) in June 2016 was $2.47 per gallon, 4.0% higher than the previous month but 14.5% lower than the same month last year.
The median analyst estimate at the beginning of July for 2016 NYMEX oil was $42.89 per barrel with a high of $65.52 per barrel and a low of $36.00 per barrel.
Natural Gas. In April 2016, total natural gas consumption was 70.4 Bcf/d, down 8.1% from the prior month but up 3.9% from the same month last year. Dry gas production in April 2016 was 73.7 Bcf/d, down 0.4% from March 2016, and down 0.8% over the same month last year.

At 3.2 Tcf (week ending 7/1/15), natural gas storage was 23.2% above the five-year historical average, and 2.2% above the five-year high. The average near-term futures price for Henry Hub in June 2016, increased to $2.624 per MMBtu or 26.6% higher than the prior month but 5.2% lower than the same month last year. The five-year strip at July 7, 2016, was $3.07 per MMBtu. The median analyst estimate at the beginning of July for 2016 NYMEX gas was $2.50 per MMBtu with a high of $3.90 per MMBtu and a low of $2.00 per MMBtu.
Rig Count — U.S. Land Rig Count Increases
The U.S. land rig count sourced from RigData on July 1, 2016, stood at 459 rigs, an increase of 44 from June 3, 2016, and a decrease of 1,635 rigs from Q3’14, of which 74% were operating horizontally.
On July 1, 2016, there were 341 horizontal rigs in the U.S., a decrease of 76% from 1,411 in Q4’2014. The number of horizontal rigs targeting natural gas exclusively dropped from December 31, 2011 by 343 rigs to 53 for a decline of 87%. The number of horizontal rigs targeting oil exclusively decreased from December 31, 2011 by 126 rigs to 72 for a decrease of 64%.

By play and as compared to Q4’14, rig count changes on April 1, 2016 include Haynesville (-25 rigs), Fayetteville Shale (-13 rigs), Woodford Shale (-4 rig), Appalachian Basin (-119 rigs), Williston Basin (-158 rigs), Eagle Ford Shale (-175 rigs), DJ Niobrara (-43 rigs) and Permian Basin (-334 rigs).
Equity Markets
In June 2016, the S&P 500, XNG, XOI and OSX changed by +0.1%, +0.2%, +2.7% and +2.0% month-to-month, respectively. The S&P 500 had the largest year-over-year increase gaining +1.7%.
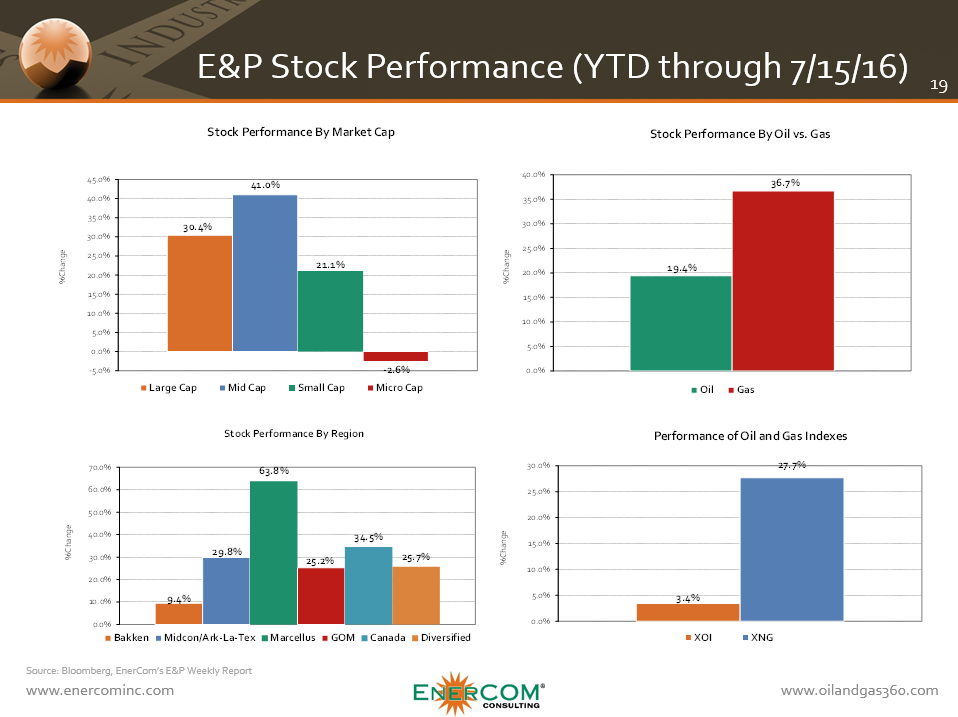
From EnerCom’s E&P Database: For July 1, 2016, year-to-date large-cap, mid-cap, small-cap and micro-cap E&P stocks changed by +30.9%, +41.5%, +29.8% and -6.3%, respectively. Year-to-date, oil-weighted and gas-weighted companies gained +18.6% and +39.0%, respectively.
By region as of July 1, 2016, year-to-date, Bakken, Midcontinent, Marcellus, Gulf of Mexico, Canada, and Diversified stocks changed by +16.2%, +32.8%, +71.2%, +25.4%, +31.7%, and +27.4% respectively.
From EnerCom’s Oil Service’s Database: As of July 1, 2016, year-to-date, Oil Service’s large-cap and mid-cap stocks changed by -0.9%, +2.2%, respectively, while small-cap and micro-cap stocks changed by +3.7%, and +7.4% respectively.
Expected Themes for Conference Calls
Below are some themes and thoughts we expect to take prominence on this quarter’s conference calls.
E&P Companies:
- Liquidity, capital market funding, and debt maturities
- 2017 commodity price outlook
- Potential for increasing M&A activity in E&P
- Hedge position and cost control
- Midstream contracts and take-away capacity
- 2016 CapEx and activity levels – exploration vs. development
- Oilfield service costs and outlook
- Crude oil and natural gas differentials (Wattenberg, Bakken, etc.)
- Crude delivery and refining systems (rail systems, etc.)
- Wells drilled awaiting delayed completions
OilService Companies:
- Global economic outlook
- 2016 CapEx and activity levels
- Potential for increasing M&A
- Balance sheet strength and near-term debt maturities
- Health of customer base
- Rig Count – Effects of drilling efficiencies
- Trends and outlook on dayrates and backlog (onshore and offshore drillers)
- Oilfield service equipment utilization rates
- Backlog of completions
