Q1 Reporting Kicks Off Tomorrow for the Oil & Gas Industry
The first quarter closed on March 31 for most of the U.S. oil and gas companies, and earnings news releases and Q1 conference calls are about to hit hard and fast (see earnings calendar here).
EnerCom, Inc. has compiled first quarter earnings per share, revenue, EBITDA and cash flow per share analyst consensus estimates on 172 E&P and OilService companies in the EnerCom oil and gas company database.
EnerCom’s complete chart of earnings estimates is available here.
The median OilServices company earnings estimate for the quarter ending March 31, 2016, is ($0.11) per share compared to actual earnings per share of ($0.45) and ($0.16) for Q4’15 and Q3’15, respectively.
The median E&P company earnings estimate for the quarter ending March 31, 2016, is ($0.16) per share compared to actual earnings per share of ($1.22) and ($0.77) for Q4’15 and Q3’15, respectively.
Energy Commodities
Crude Oil
U.S. oil consumption in January 2016, was 19.3 MMBOPD, down 2.5% compared to the prior month and 1.0% lower than the same month last year. For January 2016, U.S. crude oil production was 9.1 MMBOPD, down 0.6% compared to the prior month and 1.7% lower than the same month last year. The average near-term futures price for WTI in March 2016, was $37.96 per barrel, up 24.7% from the prior month and 20.7% lower than the same month last year. The five-year strip at March 31, 2016 was $47.67 per barrel.
The average price of gasoline (all grades, all formulations) in April 2016 was $2.24 per gallon, 3.0% higher than the previous month and 12.8% lower than the same month last year.
The median analyst estimate at the beginning of April for 2016 NYMEX oil was $40.14 per barrel with a high of $65.52 per barrel and a low of $34.60 per barrel.
Natural Gas
In January 2016, total natural gas consumption was 101.1 Bcf/d, up 20.7% from the prior month and flat with the same month last year. Dry gas production in January 2016 was 74.2 Bcf/d, up 0.5% from December 2015, and up 0.8% over the same month last year.
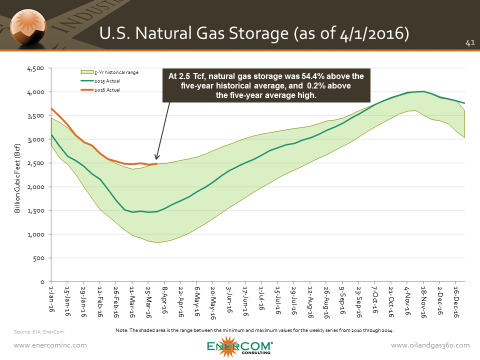
At 2.5 Tcf (week ending 4/1/15), natural gas storage was 54.4% above the five-year historical average, and 0.2% above the five-year high. The average near-term futures price for Henry Hub in March 2016, decreased to $1.81 per MMBtu or 0.7% lower than the prior month and 34.2% lower than the same month last year. The five-year strip at April 14, 2015, was $2.87 per MMBtu. The median analyst estimate at the beginning of April for 2016 NYMEX gas was $20.50 per MMBtu with a high of $3.55 per MMBtu and a low of $2.00 per MMBtu.
Rig Count — U.S. Land Rig Count Decreases
The U.S. land rig count sourced from RigData on April 1, 2016, stood at 424 rigs, an decrease of 47 from March 4, 2016, and a decrease of 1,670 rigs from Q3’14, of which 75% were operating horizontally.
On April 1, 2016, there were 317 horizontal rigs in the U.S., a decrease of 78% from 1,411 in Q4’2014. The number of horizontal rigs targeting natural gas exclusively dropped from December 31, 2011 by 340 rigs to 56 for a decline of 86%. The number of horizontal rigs targeting oil exclusively decreased from December 31, 2011 by 144 rigs to 54 for a decrease of 73%.
By play and as compared to Q4’14, rig count changes on April 1, 2016 include Haynesville (-27 rigs), Fayetteville Shale (-13 rigs), Woodford Shale (-3 rig), Appalachian Basin (-114 rigs), Williston Basin (-159 rigs),
Eagle Ford Shale (-177 rigs), DJ Niobrara (-43 rigs) and Permian Basin (-319 rigs).
Equity Markets
In March 2016, the S&P 500, XNG, XOI and OSX changed by +6.6%, +22.1%, +9.3% and +10.1% month-to-month, respectively. The S&P 500 had the smallest year-over-year decrease losing -0.4%.
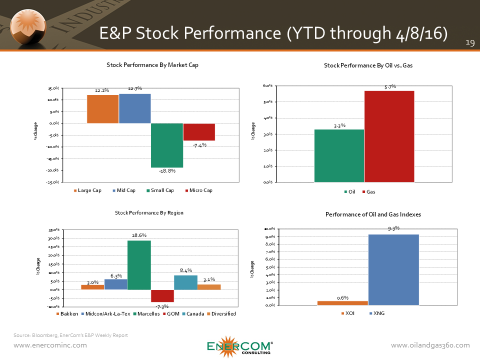
From EnerCom’s E&P Database: For April 8, 2016, year-to-date large-cap, mid-cap, small-cap and micro-cap E&P stocks changed by +12.2%, +12.7%, -18.8% and -7.4%, respectively. Year-to-date, oil-weighted and gas-weighted companies gained +3.3% and +5.7%, respectively.
By region as of April 8, 2016, year-to-date, Bakken, Midcontinent, Marcellus, Gulf of Mexico, Canada, and Diversified stocks changed by +3.0%, +6.3%, +28.6%, -7.3%, +8.4%, and +3.1% respectively.
From EnerCom’s Oil Services Database: As of April 8, 2016, year-to-date, Oil Service’s large-cap and mid-cap stocks changed by -5.3%, -1.6%, respectively, while small-cap and micro-cap stocks changed by -0.9%, and -3.1% respectively.
Expected Themes for Conference Calls
Below are some themes and thoughts we expect to take prominence on this quarter’s conference calls.
E&P Companies:
- Borrowing base redeterminations and bank price decks
- Liquidity, capital market funding, and debt maturities
- 2016 commodity price outlook
- Potential for increasing M&A activity in E&P
- Hedge position and cost control
- Midstream contracts and take-away capacity
- 2016 CapEx and activity levels – exploration vs. development
- Oilfield service costs and outlook
- Crude oil and natural gas differentials (Wattenberg, Bakken, etc.)
- Crude delivery and refining systems (rail systems, etc.)
- Wells drilled awaiting delayed completions
OilService Companies:
- Global economic outlook
- 2016 CapEx and activity levels
- Potential for increasing M&A
- Balance sheet strength and near-term debt maturities
- Health of customer base
- Rig Count – Effects of drilling efficiencies
- Trends and outlook on dayrates and backlog (onshore and offshore drillers)
- Oilfield service equipment utilization rates
- Backlog of completions


