EnerCom, Inc. compiled third quarter earnings per share, revenue, EBITDA and cash flow per share analyst consensus estimates on 216 E&P and OilService companies in our database.
Click here for the full chart of estimates.
The median OilServices company earnings estimate for the quarter ending September 30, 2015, is $0.00 per share compared to actual earnings per share of ($0.02) and $0.03 for Q2’15 and Q1’15, respectively. In Q3’14, the median OilServices company earnings were $0.29. The median E&P company earnings estimate for the quarter ending September 30, 2015, is ($0.04) per share compared to actual earnings per share of ($0.29) and ($0.20) for Q2’15 and Q1’15, respectively. In Q3’14, the average E&P company earnings was $0.39 per share.
Energy Commodities
Crude Oil. U.S. oil consumption in July 2015, was 20.0 MMBOPD, up 2.0% compared to the prior month and 3.6% higher than the same month last year. For July 2015, U.S. crude oil production was 9.4 MMBOPD, up 1.0% compared to the prior month and 7.0% higher than the same month last year. The average near-term futures price for WTI in September 2015, was $45.47 per barrel, up 6.0% from the prior month but 53.8% lower than the same month last year. The five-year strip at September 30, 2015 was $53.75 per barrel.
The average price of gasoline (all grades, all formulations) in September 2015 was $2.46 per gallon, 9.7% lower than the previous month and 29.3% lower than the same month last year. In September 2015, the average near-term futures price for Brent was $48.54 per barrel, up 0.7% from the prior month and 6.8% higher than the WTI near-month futures price.
The median analyst estimate at the beginning of October for 2015 NYMEX oil was $59.00 per barrel with a high of $65.63 per barrel and a low of $48.00 per barrel.
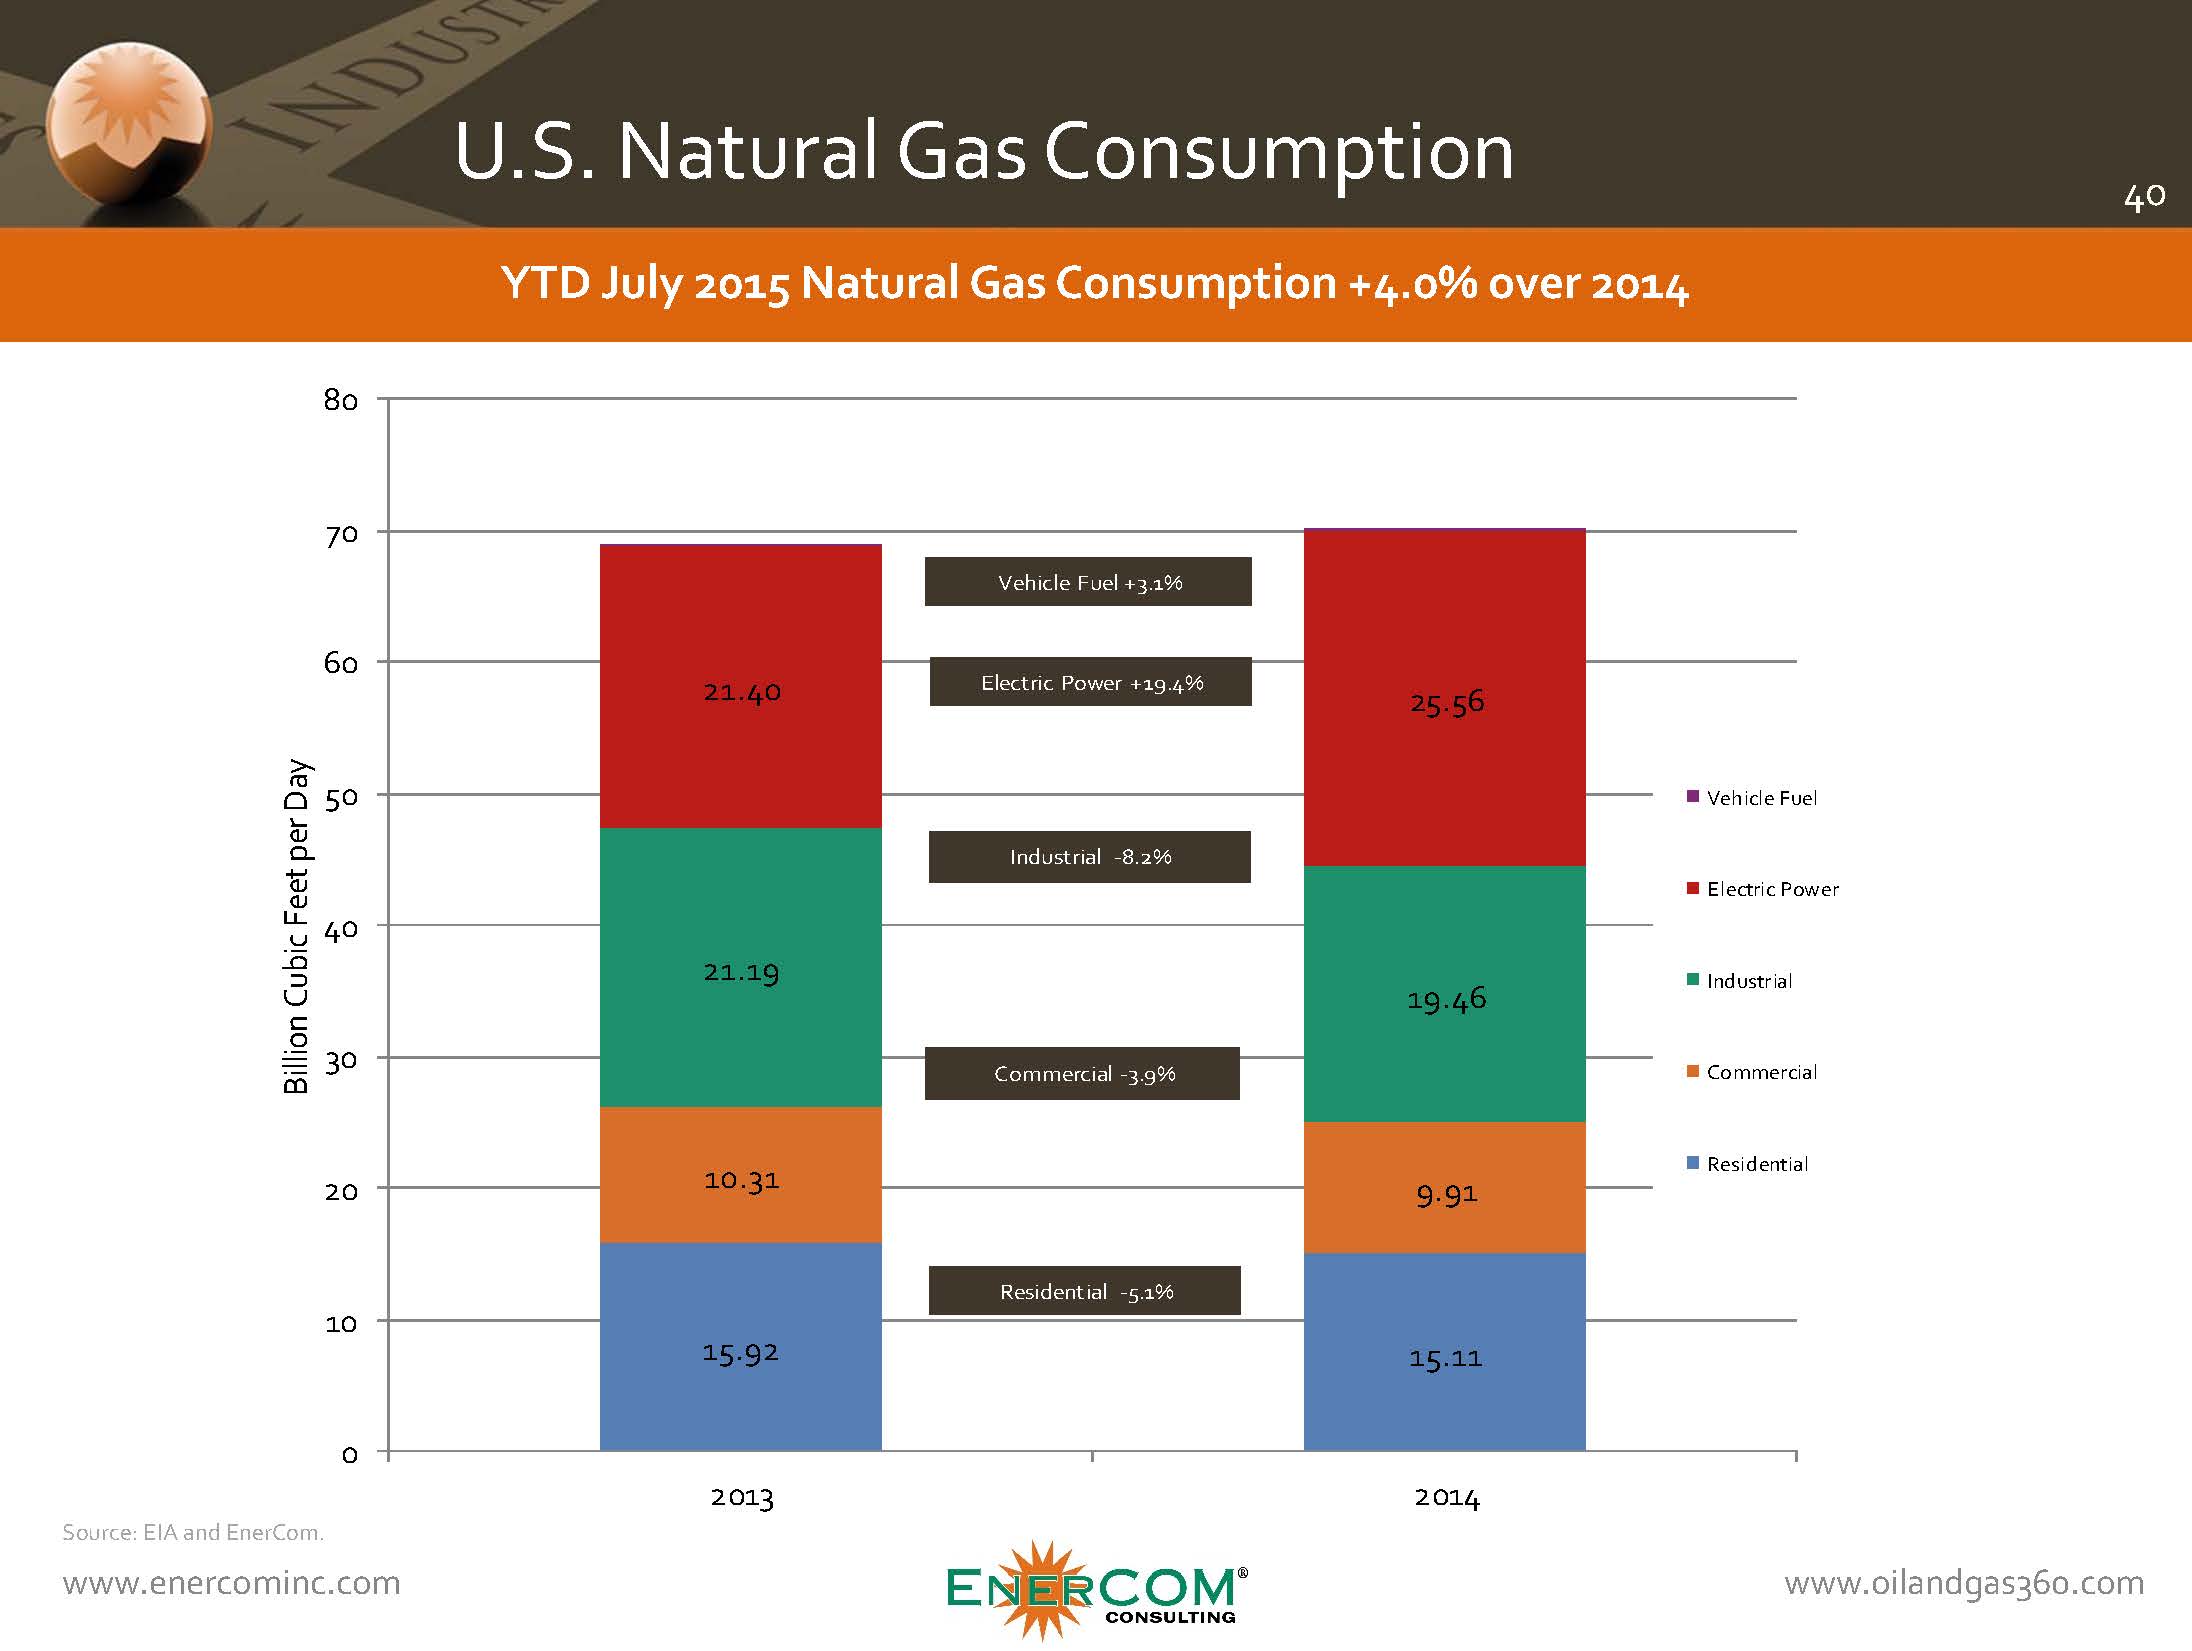
Natural Gas. In July 2015, total natural gas consumption was 67.1 Bcf/d, up 5.1% from the prior month and 10.3% higher than the same month last year. Dry gas production in July 2015 was 74.7 Bcf/d, up 0.3% from June 2015, and up 6.7% over the same month last year.
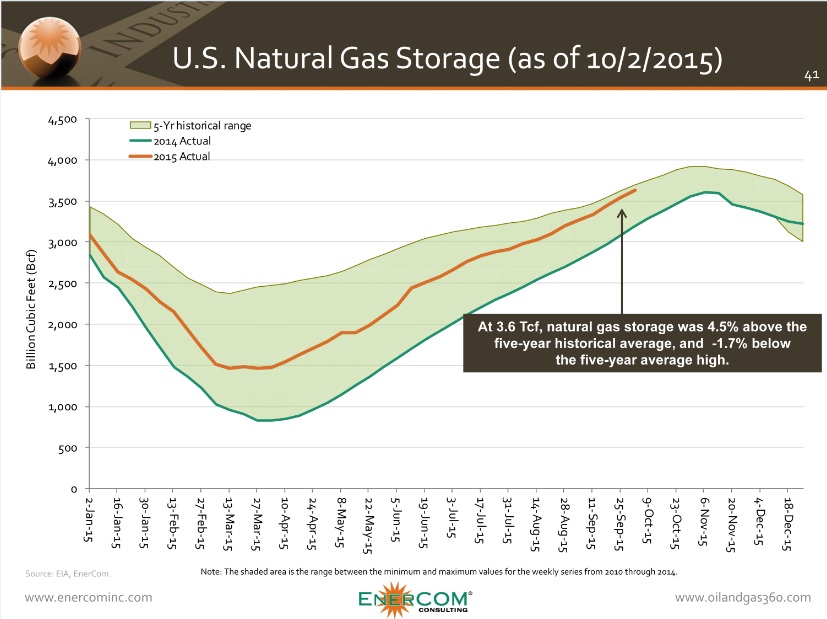
At 3.6 Tcf (week ending 10/2/15), natural gas storage was 4.5% above the five-year historical average, and 1.7% below the five-year high.
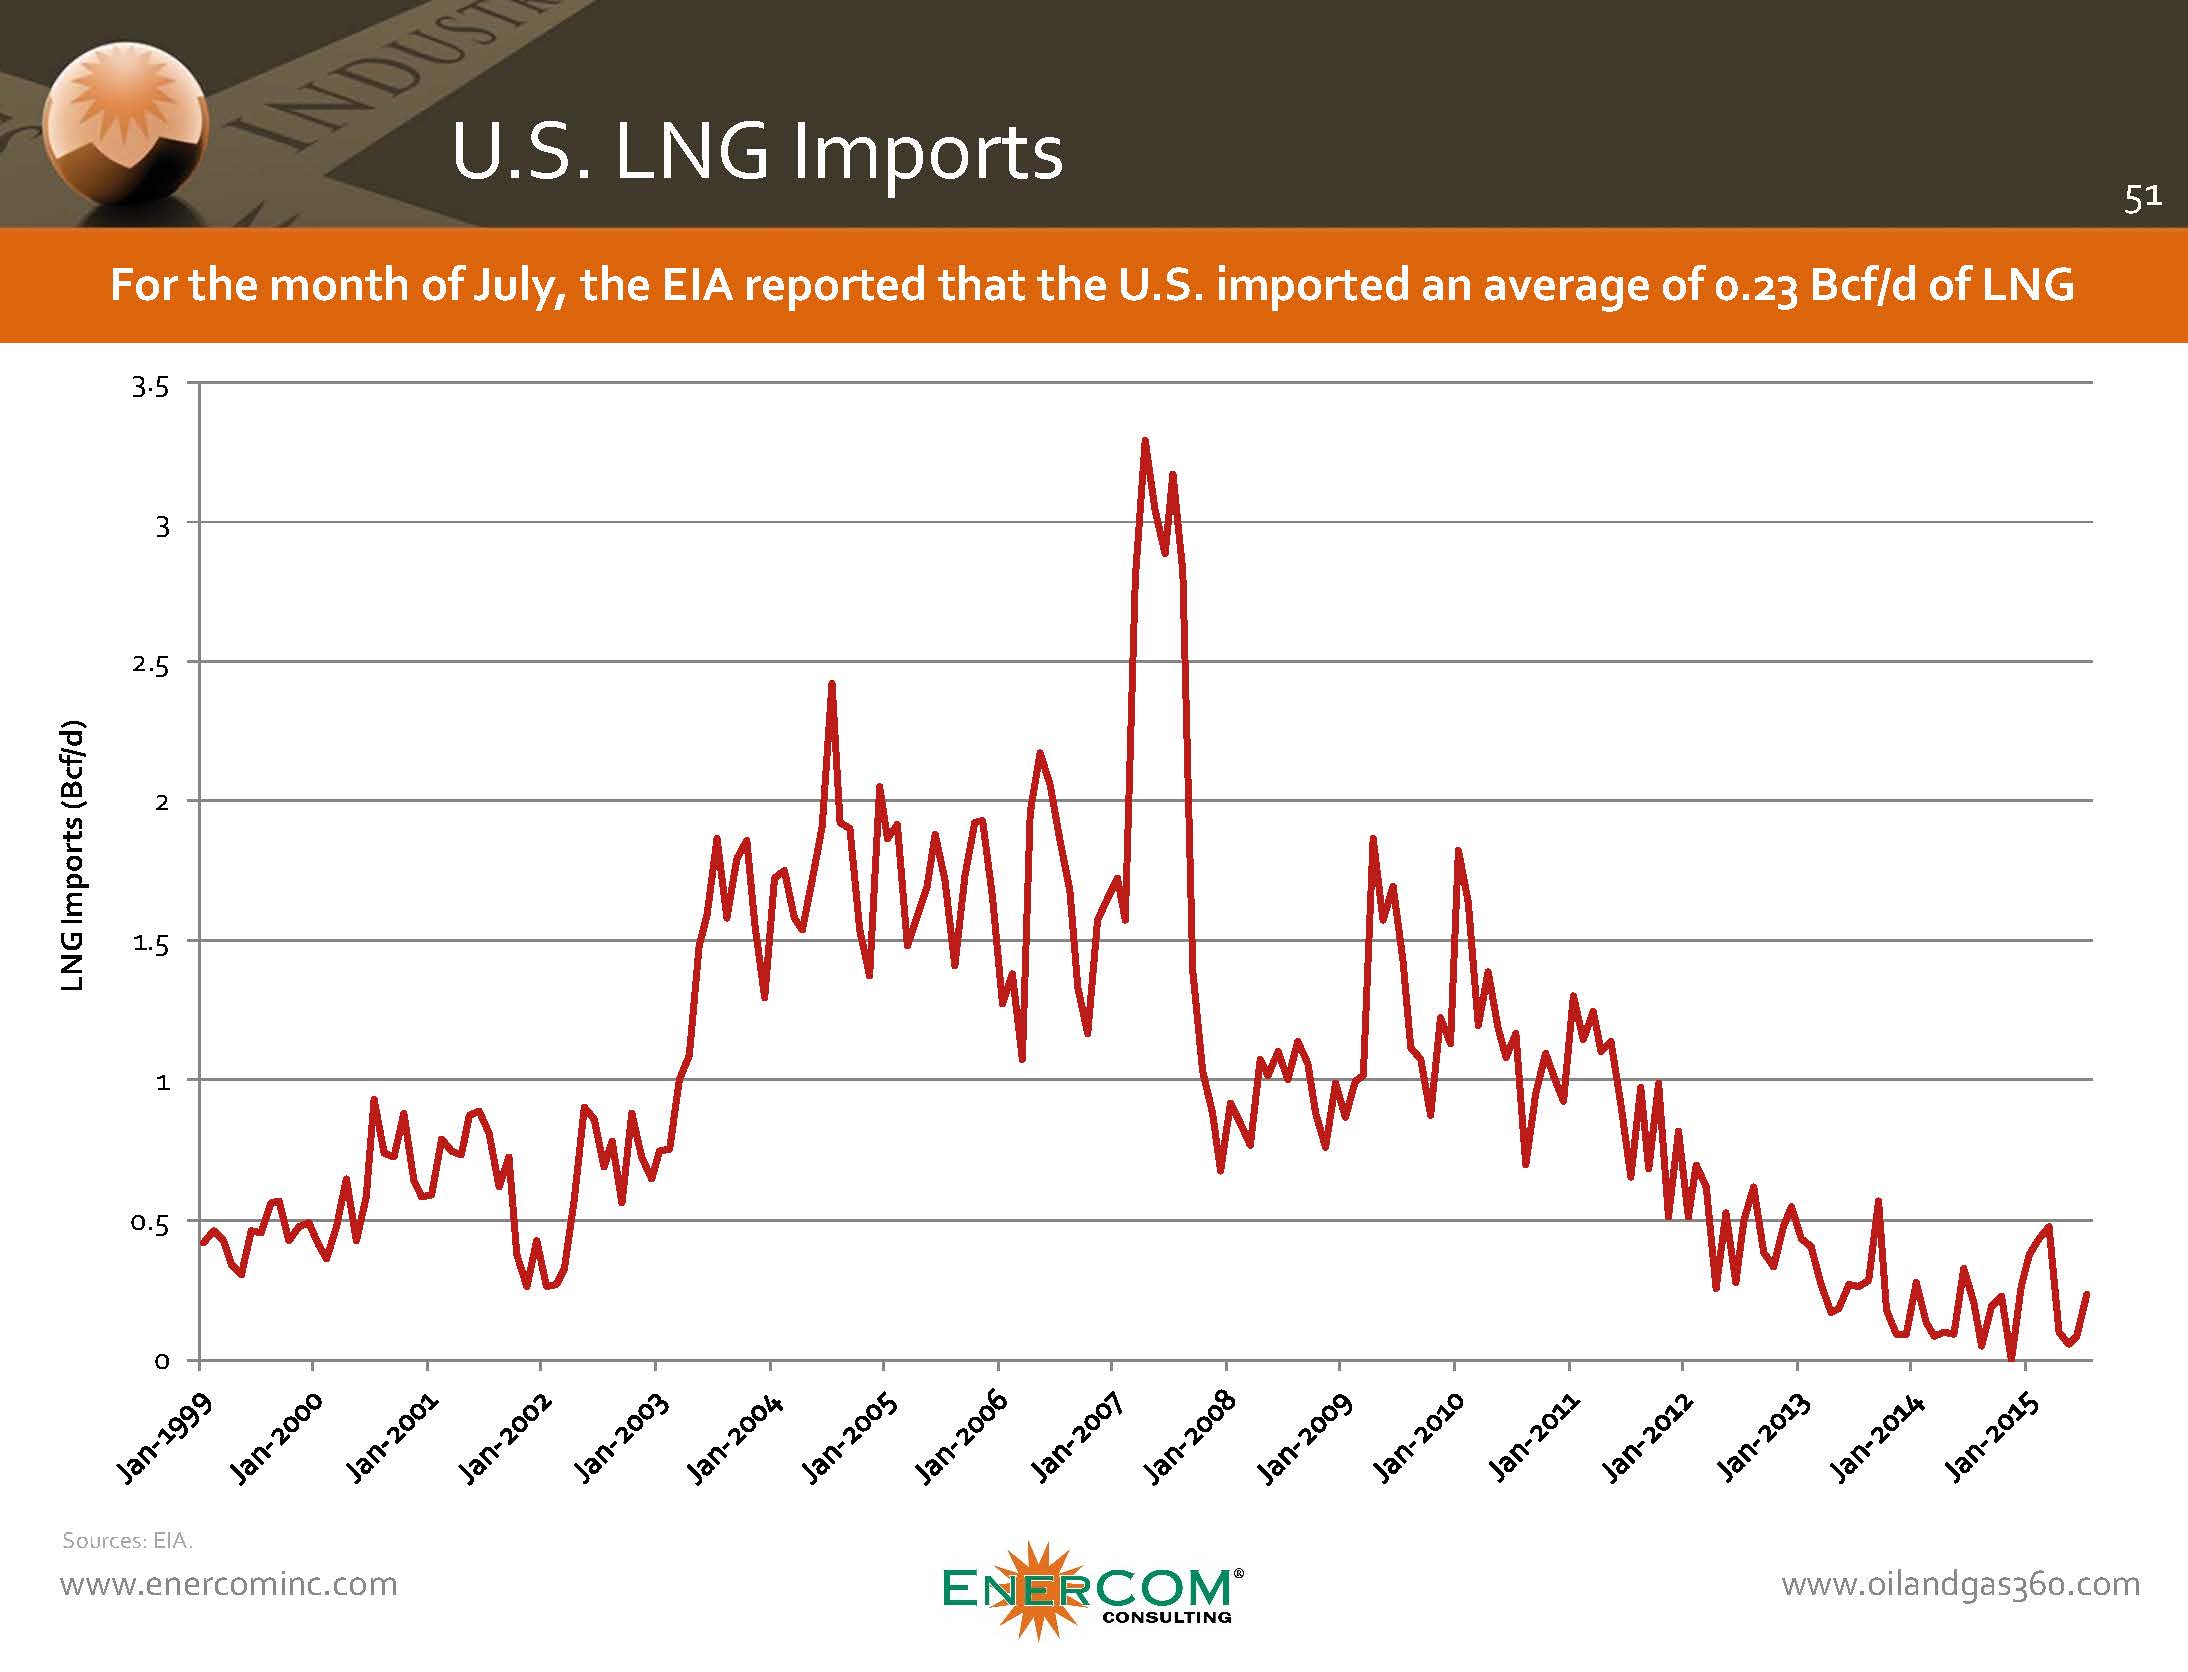
For the month of July 2015 (the most recent data point), the EIA reported that U.S. LNG imports averaged 0.23 Bcf/d.
The average near-term futures price for Henry Hub in September 2015, increased to $2.64 per MMBtu or 4.0% lower than the prior month and 32.7% lower than the same month last year. The five-year strip at September 30, 2015, was $3.01 per MMBtu. The median analyst estimate at the beginning of October for 2016 NYMEX gas was $3.48 per MMBtu with a high of $4.00 per MMBtu and a low of $2.89 per MMBtu.
Rig Count — U.S. Land Rig Count Decreases
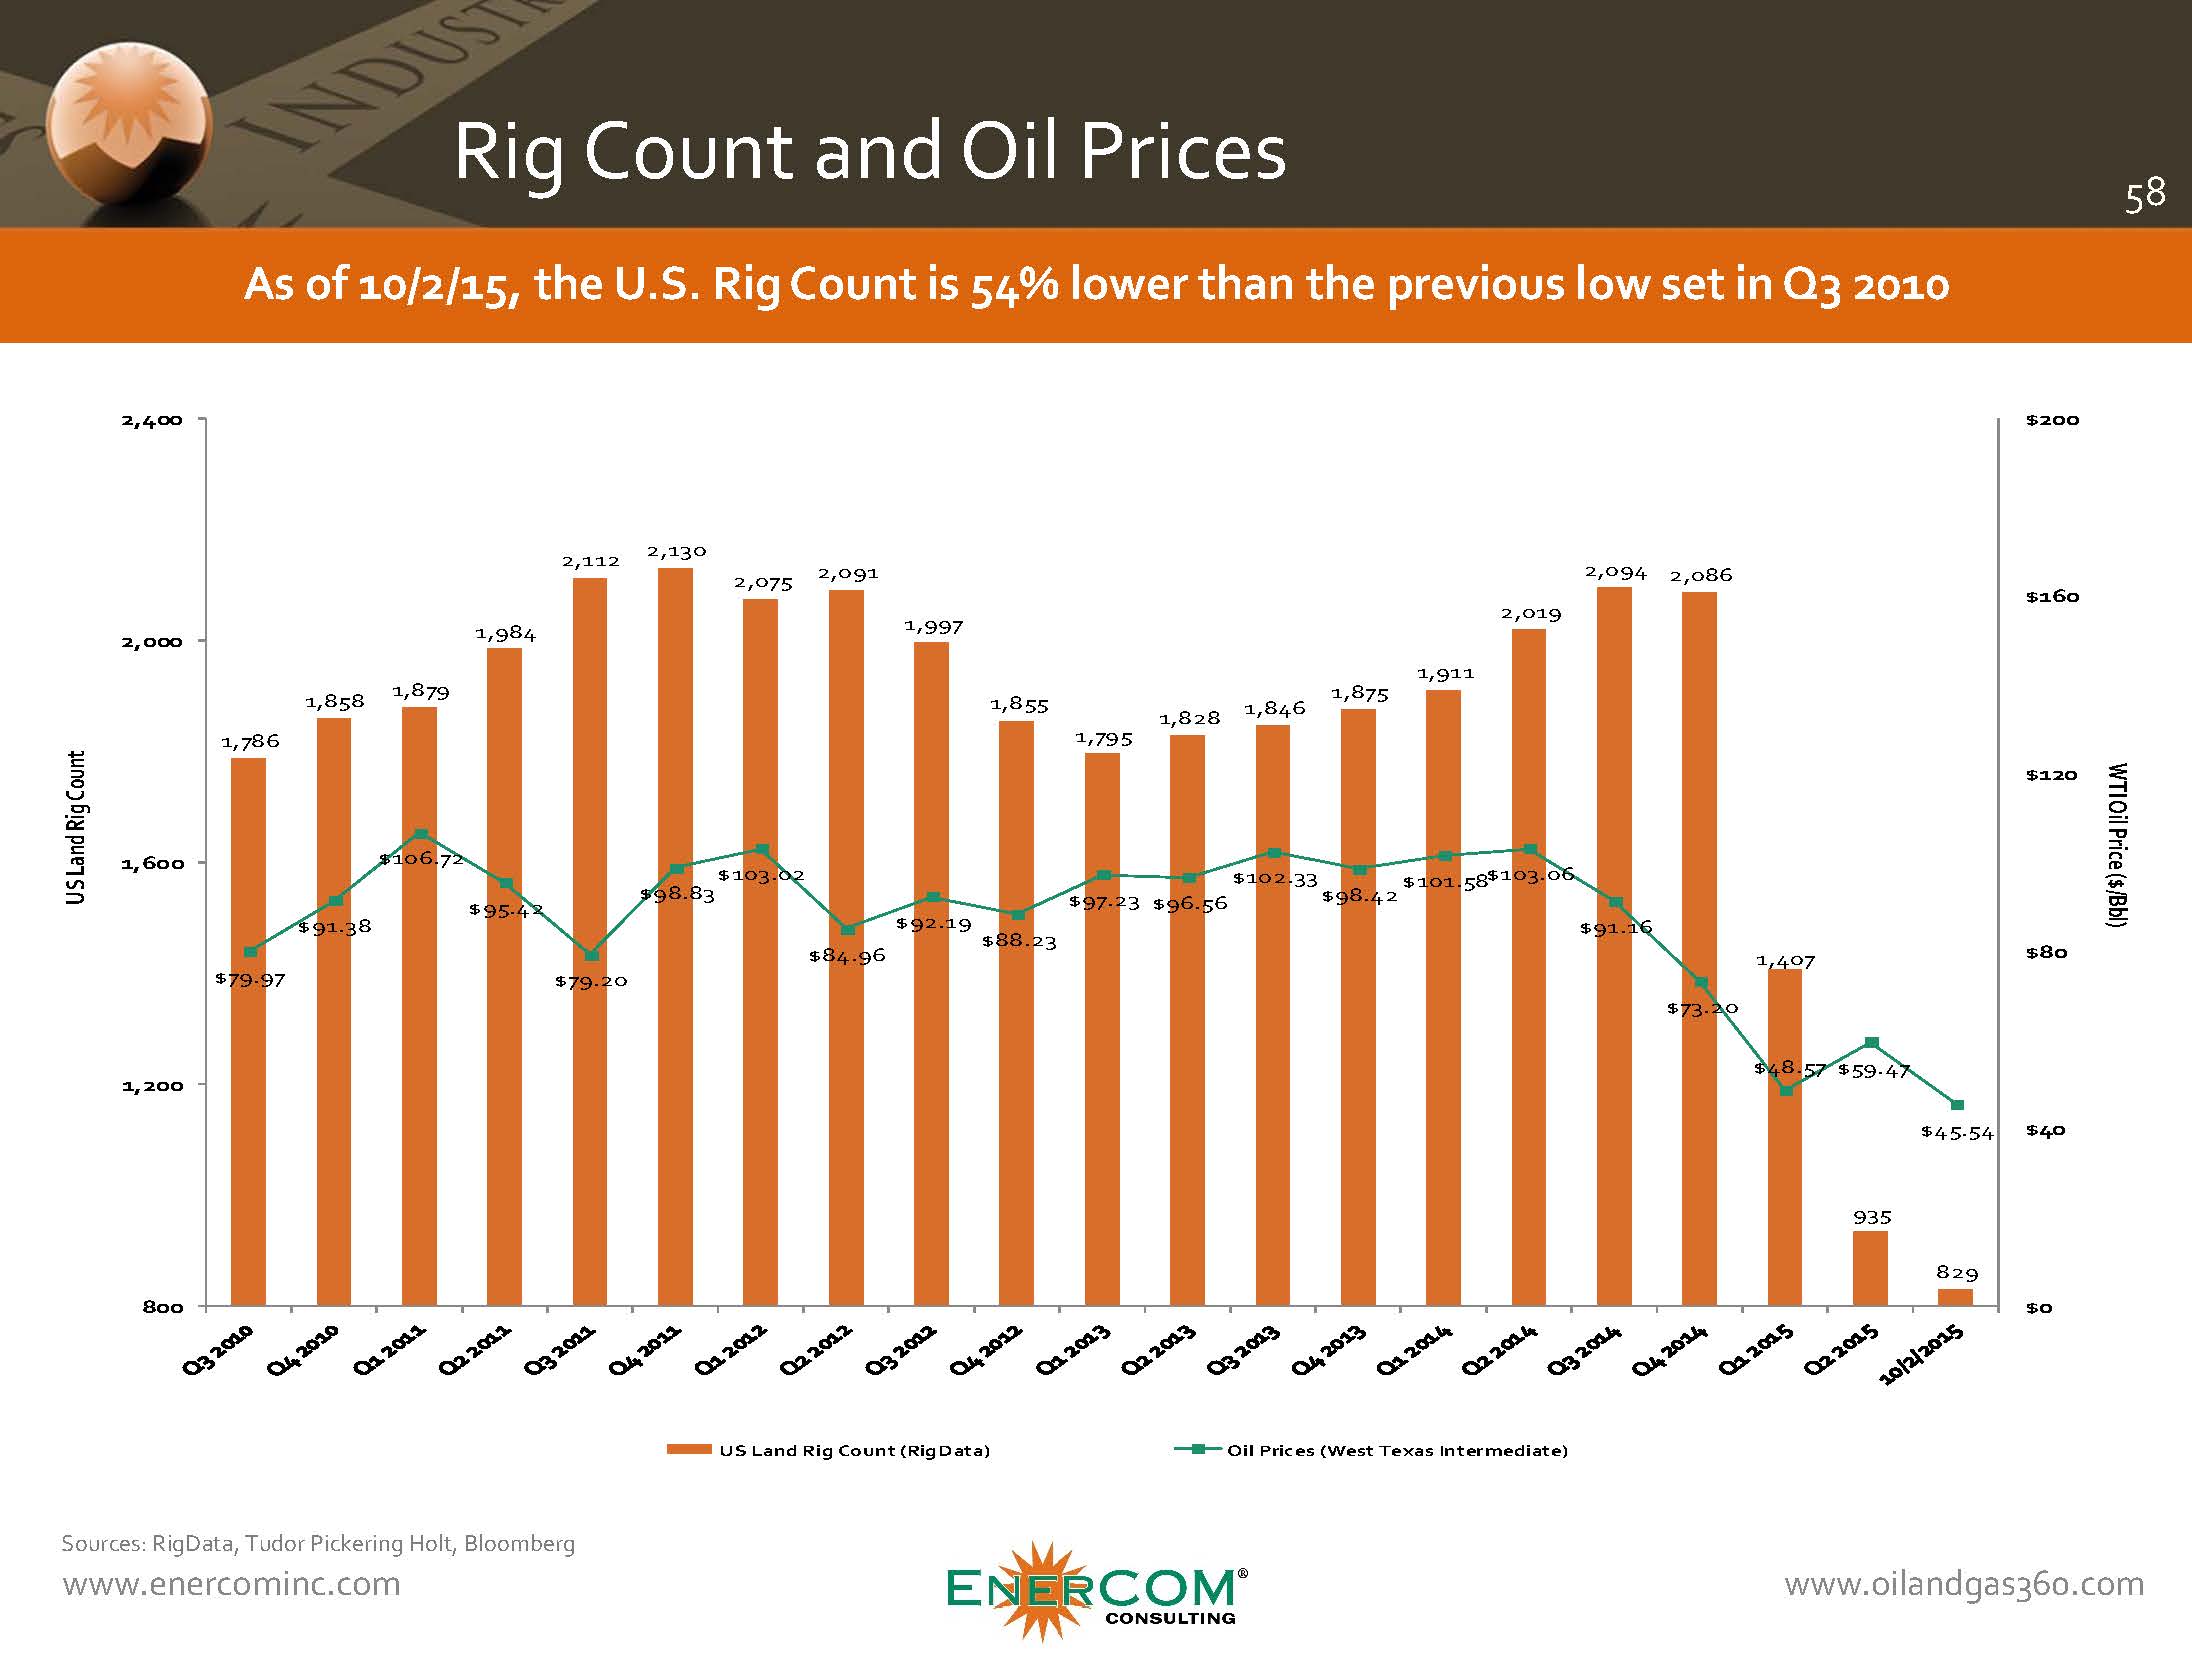
The U.S. land rig count sourced from RigData on October 2, 2015, stood at 829 rigs, an decrease of 61 from September 11, 2015, and a decrease of 1,265 rigs from Q3’14, of which 71% were operating horizontally.
On October 2, 2015, there were 590 horizontal rigs in the U.S., a decrease of 58% from 1,411 in Q4’2014. The number of horizontal rigs targeting natural gas exclusively dropped from December 31, 2011 by 287 rigs to 109 for a decline of 72%. The number of horizontal rigs targeting oil exclusively decreased from December 31, 2011 by 78 rigs to 120 for a decrease of 39%.
By play and as compared to Q4’14, rig count changes on October 2, 2015 include Haynesville (-20 rigs), Fayetteville Shale (-6 rigs), Woodford Shale (+2 rigs), Appalachian Basin (-80 rigs), Williston Basin (-121 rigs), Eagle Ford Shale (-143 rigs), DJ Niobrara (-32 rigs) and Permian Basin (-281 rigs).
Equity Markets. In September 2015, the S&P 500, XNG, XOI and OSX changed by -2.6%, -9.5%, -7.5% and -14.2% month-to-month, respectively. The S&P 500 had the smallest year-over-year decrease losing -2.6% (Slide 23).
From EnerCom’s E&P Database: For October 2, 2015, year-to-date large-cap, mid-cap, small-cap and micro-cap E&P stocks lost -27.5%, -24.8%, -45.7% and -60.0%, respectively. Year-to-date, oil-weighted and gas-weighted companies lost -40.2% and -44.5%, respectively.
By region as of October 2, 2015, year-to-date, Bakken, Midcontinent, Marcellus, Gulf of Mexico, Canada, and Diversified stocks lost -52.2%, -7.2%, -39.6%, -65.8%, -38.4% and -32.9% respectively.
From EnerCom’s Oil Service’s Database: As of October 2, 2015, year-to-date, Oil Service’s large-cap and mid-cap stocks lost -19.9% and -30.7%, respectively, while small-cap and micro-cap stocks lost -40.1%, and -51.7% respectively.
Expected Themes for Conference Calls
Below are some themes and thoughts we expect to take prominence on this quarter’s conference calls.
E&P Companies:
- 2016 commodity price outlook
- Potential for U.S. oil exports is building steam
- Hedge position and cost control
- Balance sheet strength and near-term debt maturities
- Borrowing base redeterminations and bank price decks
- Midstream contracts and take-away capacity
- 2015 CapEx and activity levels – exploration vs. development
- Oilfield service costs and outlook
- Crude oil and natural gas differentials (Wattenberg, Bakken, etc.)
- Crude delivery and refining systems (rail systems, etc.)
- Potential for increasing M&A activity in E&P
- Year-end reserves vs. current reserves at $53/bbl oil
- Storage and refining capacities
- Wells drilled awaiting delayed completions
OilService Companies:
- Global economic outlook
- 2016 CapEx and activity levels
- Potential for increasing M&A
- Balance sheet strength and near-term debt maturities
- Government permitting for LNG ports
- Growing pressure for US to export
- Shrinking International margins vs. North American margins
- Rig Count – Effects of drilling efficiencies
- Trends and outlook on dayrates and backlog (onshore and offshore drillers)
- Oilfield service equipment utilization rates
- Backlog of completions
- Frac sand and proppant prices
Important disclosures: The information provided herein is believed to be reliable; however, EnerCom, Inc. makes no representation or warranty as to its completeness or accuracy. EnerCom’s conclusions are based upon information gathered from sources deemed to be reliable. This note is not intended as an offer or solicitation for the purchase or sale of any security or financial instrument of any company mentioned in this note. This note was prepared for general circulation and does not provide investment recommendations specific to individual investors. All readers of the note must make their own investment decisions based upon their specific investment objectives and financial situation utilizing their own financial advisors as they deem necessary. Investors should consider a company’s entire financial and operational structure in making any investment decisions. Past performance of any company discussed in this note should not be taken as an indication or guarantee of future results. EnerCom is a multi-disciplined management consulting services firm that regularly intends to seek business, or currently may be undertaking business, with companies covered on Oil & Gas 360®, and thereby seeks to receive compensation from these companies for its services. In addition, EnerCom, or its principals or employees, may have an economic interest in any of these companies. As a result, readers of EnerCom’s Oil & Gas 360® should be aware that the firm may have a conflict of interest that could affect the objectivity of this note. The company or companies covered in this note did not review the note prior to publication.
