Cabot Oil & Gas (ticker: COG) continued its rise in production volume in its Q1’15 results, reporting production of 171.4 Bcfe in the quarter. The volume represents increases of 15% and 43% compared to Q4’14 and Q1’14, respectively. Total revenues of $464.7 million amounted to net income of $40.2 million, or $0.10 per share.
Volumes are expected to be reduced in the upcoming quarter due to the current commodity environment. The average sales price in Q1’15, including hedges, was $2.46 – more than one-third below the average price of $3.74 in Q1’14. At $2.45/Mcf, COG still generates an 80% internal rate of return. Realized gas prices traded at $2.23 in the quarter, representing a $0.75 discount to NYMEX prices compared to a $0.59 discount in Q1’14. Total unit costs (including financing) of $2.33/Mcfe are 12% lower on a year-over-year comparison.
Global Hunter Securities said the guidance for Q2’15 “likely mutes” the Q1’15 volumes, which beat street estimates. When discussing the forecasted production decrease, Dan Dinges, President and Chief Executive Officer of Cabot Oil & Gas, said, “We think, from a prudency standpoint, it was our best interest to protect shareholder assets and not to compromise our margin to the extent that the current price would yield.”
COG’s borrowing base was increased to $3.4 billion (from $3.1 billion) prior to the end of the quarter and lender commitments have climbed to $1.8 billion (from $1.4 billion). The company had $265 million in outstanding borrowings at the end of the quarter. Net debt at the time of the release was $1,863 million, amounting to a debt to market cap percentage of 13%. By comparison, 86 peer companies in EnerCom’s Weekly Benchmarking Report have a median debt to market cap of 56%.
A Marcellus Leader
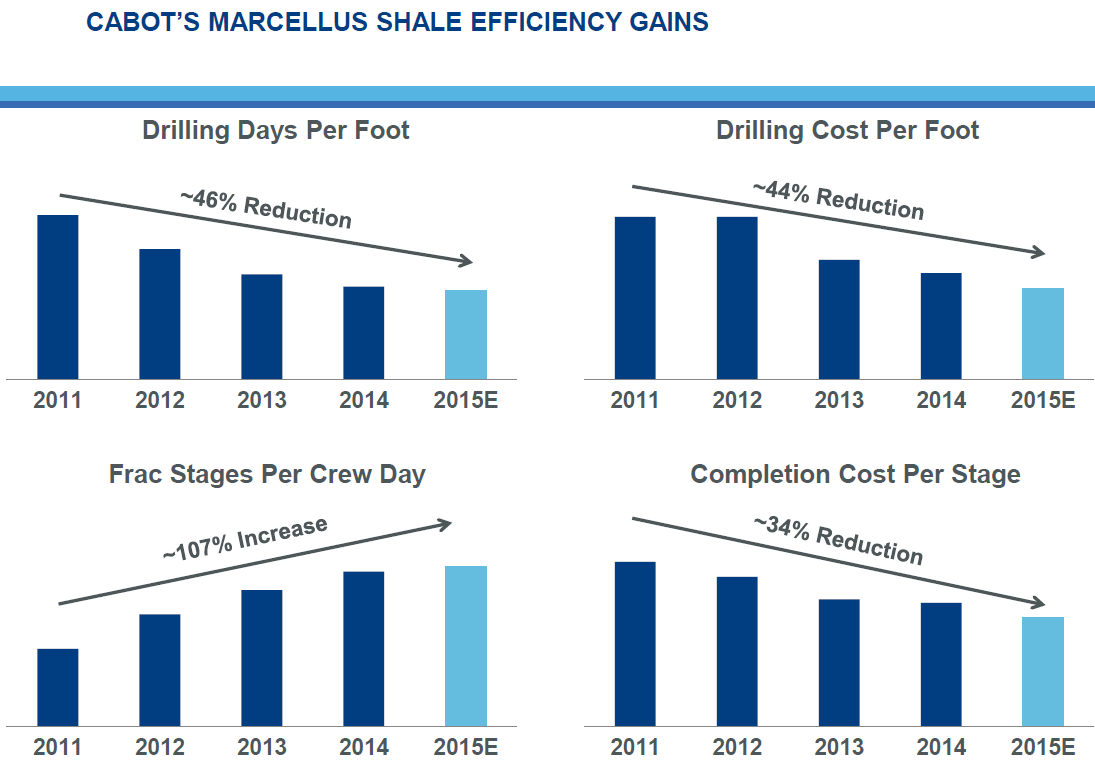
Cabot has historically returned value in the Marcellus region due to its efficiency, low finding and developing costs ($0.68/MMcf on a trailing three-year basis, the third lowest in EnerCom’s Benchmarking Report) and high return wells (COG had 17 of the top 20 cumulative producing Pennsylvania wells in 2H’14). The company drilled 26 Appalachia wells at an average of 15 days apiece in Q1’15, marking its most efficient quarter to date. The faster drilling times have resulted in drilling and completion costs declining by as much as 20% when compared to 2014. Overall, the wells are tracking as much as 50% above type curves.
Cabot plans on running three Marcellus rigs for the remainder of the year and expects gross volumes to average 1,550 to 1,600 MMcf/d in Q2’15 – about 9% below volumes from Q1’15 but a reiteration of previous guidance. In the conference call, Dinges said, “In light of our expectations for continued weakness throughout Appalachia during the summer months, we do often reevaluate our program and may consider delaying completions as we await a more favorable price environment in the future.”
A total of 45 Marcellus wells are expected to be drilled in its 2015 drilling program. Based on production data from the state of Pennsylvania, COG was the top producer in the first two months of 2015, even though the E&P has never run more than six rigs in the region.
Constitution Update
Cabot’s access to the Constitution Pipeline was a very popular topic in its Q4’14 conference call, and Dinges provided an update in the call on April 24. He said:
“The project remains on its current schedule for end service during the second half of 2016. The New York DC is currently finalizing responses to the comments received during the public comment period. Constitution now has possession of 100% of all the tracks necessary to begin construction. Constitution is working towards the finalization of New York State permit by the end of the second quarter, and FERC implementation plan is expected to be filed by Williams during the second quarter. Based on the progress during the last few months, we continue to optimistic that construction can begin mid-summer, assuming all these permits are in hand.”
Barclays estimates the addition of Constitution could add 15% to 20% in cash flow as a result of higher volumes and lower differentials. The pipeline will be filled immediately upon commissioning.
Eagle Ford Ramping Up
Production from its South Texas assets climbed 19% compared to Q4’14, reaching an average of 17,831 BOEPD. COG placed 20 wells online in the quarter, with 10 of the wells outperforming production rates from the previous operators. Similar to the Marcellus, drilling efficiencies are also on the rise in the Eagle Ford with drilling days declining to an average of just 10.6 per well. Completion costs have dropped by roughly 25% compared to 2014.
 Two rigs are currently running in the play with expectations of reducing one by the end of May. A total of 45 net wells are expected to be drilled within the fiscal year, and COG management says the company can generate 50% rates of return at $65/barrel.
2015 Forecast
The company plans on spending $900 million in its 2015 capital plan, down nearly 40% from 2014’s total of $1,479 million. Its growth guidance of 10% to 18% remains intact, which would place fiscal 2015 volumes at greater than 600 Bcfe. Capital One Securities believes hitting the upper end of guidance “looks very achievable” based on a “very strong Q1 production beat.”
Since 2012: Proved Reserves Double, Marcellus Completion Costs Cut by Half
The room for growth is significant – COG estimates 4,300 drilling locations remain on its acreage and will add to its proved reserve base, which has nearly doubled since 2012 to reach 7.4 Tcfe. Marcellus completion costs per Mcfe have halved in the same time frame.
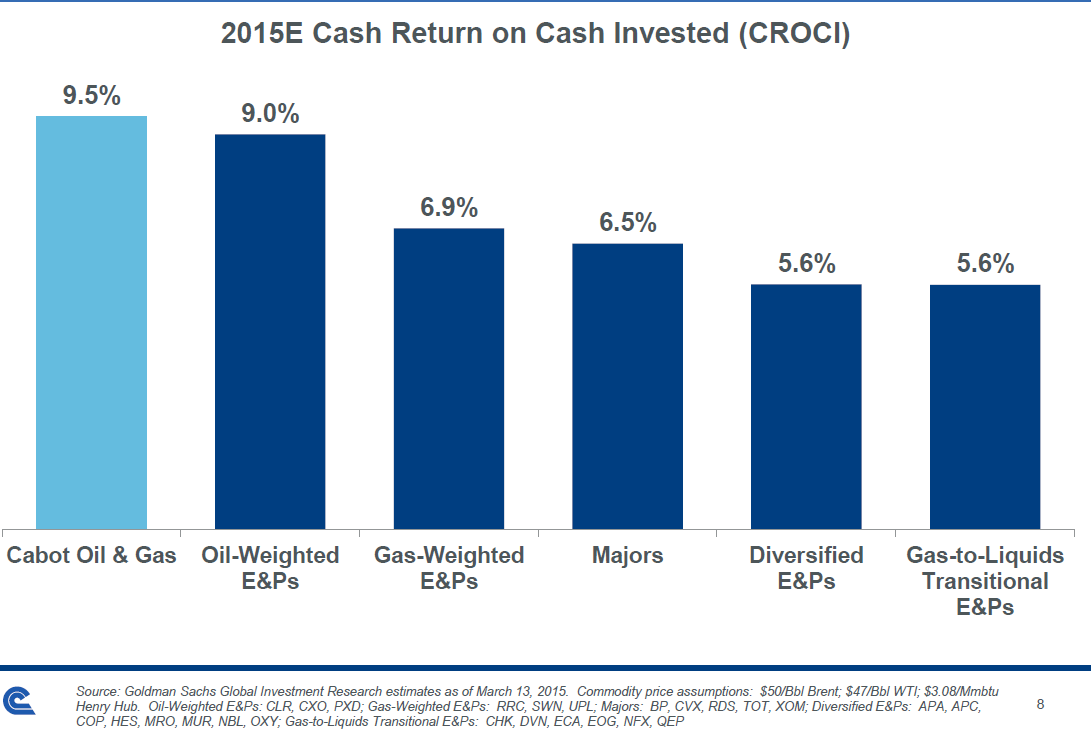
KLR Group provided a very positive review in a note following the earnings call.”Given the lowest capital intensity in the industry, Cabot should generate a ’15 capital yield of ~110% versus the industry median ~85,” the company said. “A clear illustration of COG’s differential capital productivity is the company’s ability to achieve competitive production/CFPS growth (’15E-’17E) spending inside cash generation; while Marcellus peers spend at least 20% in excess of cash generation.”
Asset intensity, defined by EnerCom Analytics as the percentage of EBITDA necessary to maintain production, is 29% – well below the E&P median of 61% and the seventh lowest overall. The low costs allow Cabot to adjust rather quickly if prices recover in the short term. “Keep in mind that the capital intensity necessary for us to ramp up our volumes is minimal,” said Dinges.
Important disclosures: The information provided herein is believed to be reliable; however, EnerCom, Inc. makes no representation or warranty as to its completeness or accuracy. EnerCom’s conclusions are based upon information gathered from sources deemed to be reliable. This note is not intended as an offer or solicitation for the purchase or sale of any security or financial instrument of any company mentioned in this note. This note was prepared for general circulation and does not provide investment recommendations specific to individual investors. All readers of the note must make their own investment decisions based upon their specific investment objectives and financial situation utilizing their own financial advisors as they deem necessary. Investors should consider a company’s entire financial and operational structure in making any investment decisions. Past performance of any company discussed in this note should not be taken as an indication or guarantee of future results. EnerCom is a multi-disciplined management consulting services firm that regularly intends to seek business, or currently may be undertaking business, with companies covered on Oil & Gas 360®, and thereby seeks to receive compensation from these companies for its services. In addition, EnerCom, or its principals or employees, may have an economic interest in any of these companies. As a result, readers of EnerCom’s Oil & Gas 360® should be aware that the firm may have a conflict of interest that could affect the objectivity of this note. The company or companies covered in this note did not review the note prior to publication. EnerCom, or its principals or employees, may have an economic interest in any of the companies covered in this report or on Oil & Gas 360®. As a result, readers of EnerCom’s reports or Oil & Gas 360® should be aware that the firm may have a conflict of interest that could affect the objectivity of this report.
