PLS Capitalize™ Report: Oil & gas industry raised $186 Billion through U.S. public offerings in 2016; PLS predicts surge in M&A activity in 2017
Houston’s oil and gas research firm PLS Inc. provided the following statistical review of capital markets activity today, with the help of its capital markets tracking platform Capitalize™.
Highlights of the PLS Capitalize™ report include:
- Aggregate deal value down 5% in 2016: $186 billion in 2016, down from $196 billion in 2015
- Number of deals up: 346 bond and equity deals in 2016, up 7.5% from 322 deals in 2015
- $53 billion in equity offerings in 2016
- $133 billion in bond issuances in 2016
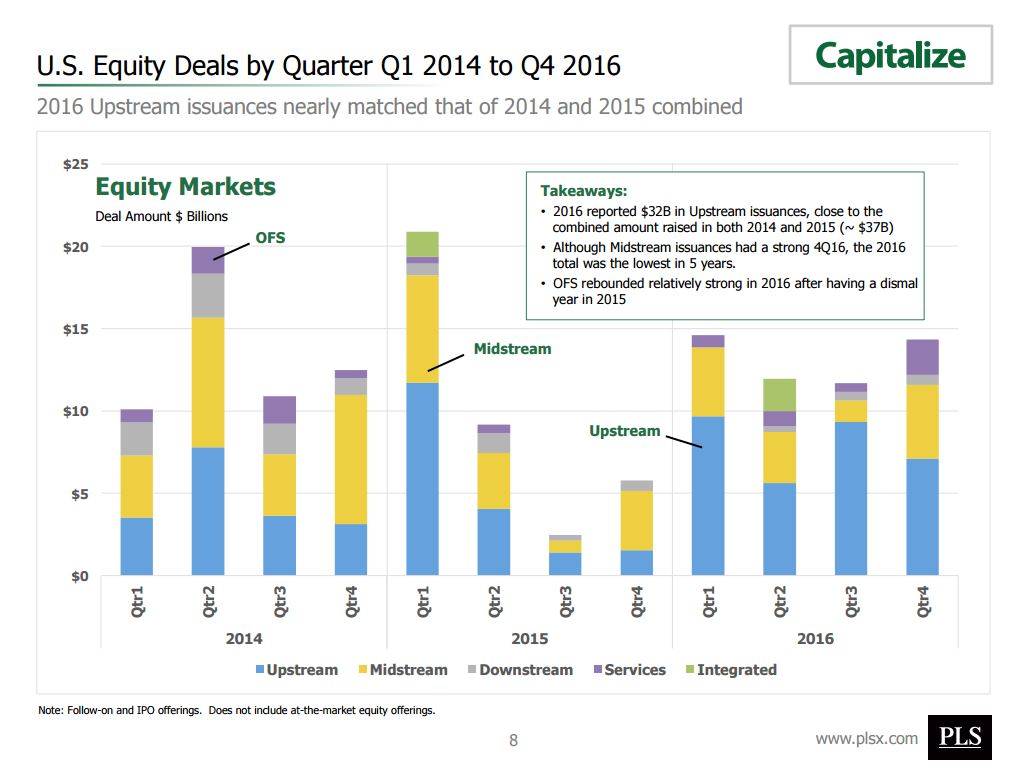
- Equity financing activity in upstream sector surged 69% over 2015 offerings
- Upstream sector: 80 equity deals at $31.7 billion (60% of equity deal amount offered in 2016) and 70 bond deals at $46 billion (35% of bond deal amount offered in 2016)
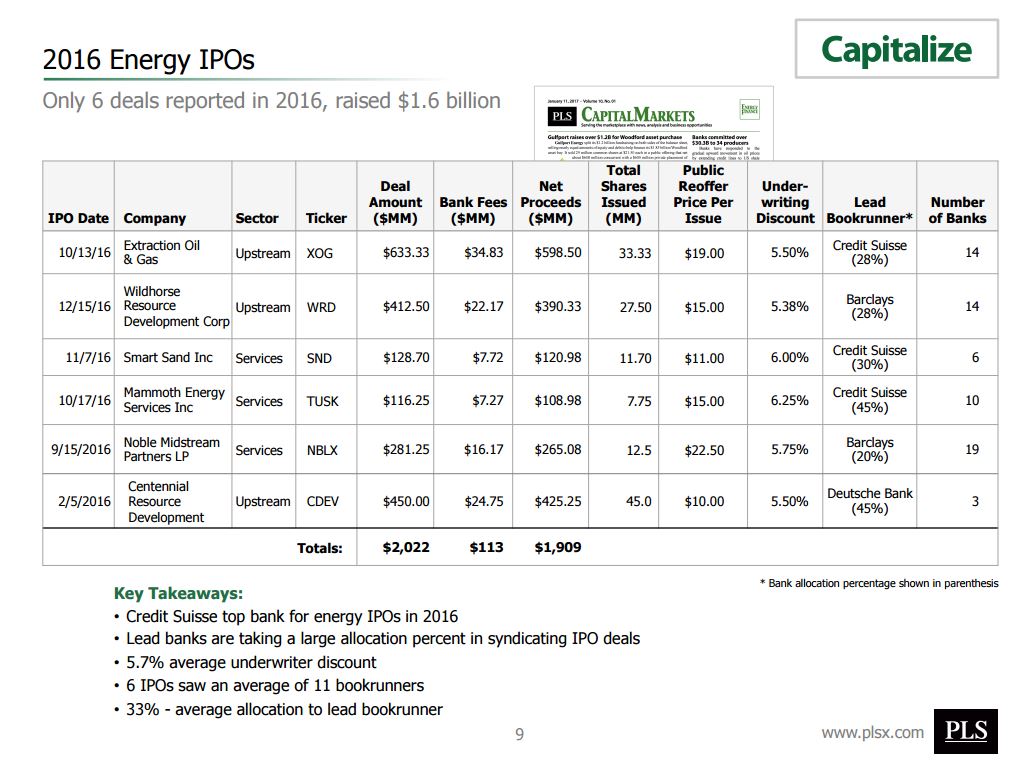
- IPO slowdown, with only 6 energy IPOs last year in upstream and services sectors
- Virtually no MLPs went public in 2016
- Banks earned $1.3 billion in aggregate fees for equity secondary offerings and IPOs on a total deal amount of $53 billion
- Issuing bonds earned banks $1.3 billion in fees on an aggregate $133 billion in deals
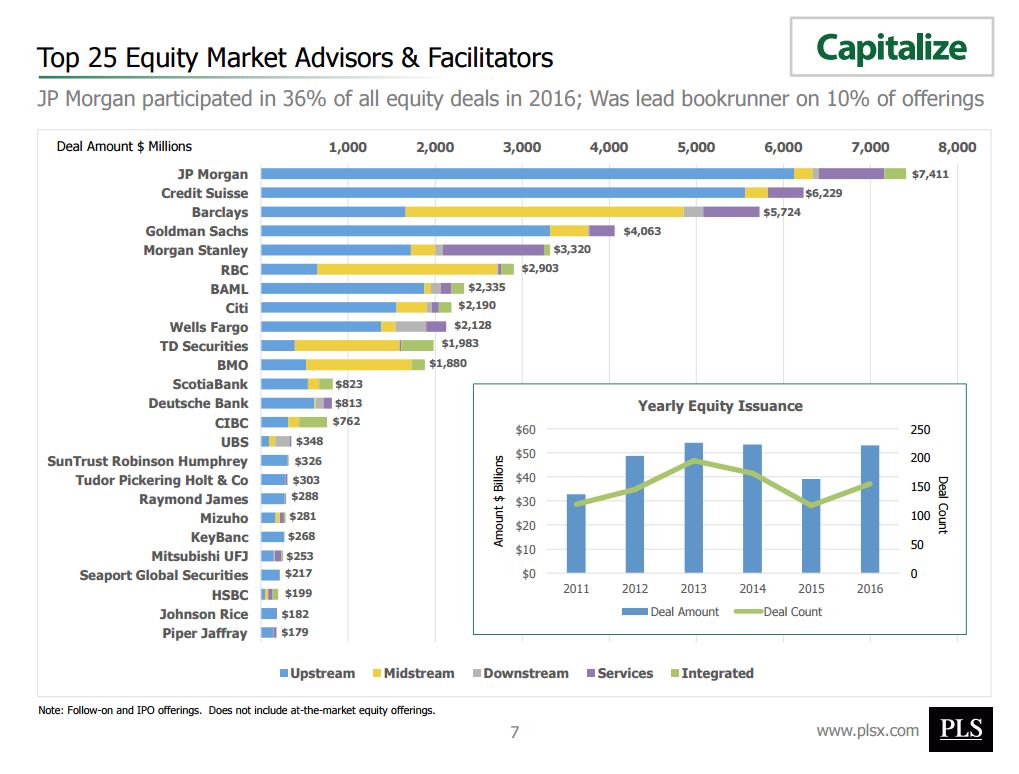
- JP Morgan most active underwriter on equity and bond offerings in the U.S. energy markets, with a market share of 14% on equity and 12% on bond deal amounts
- Credit Suisse lead underwriter on 3 out of the 6 energy IPOs in 2016
- The expectation of lower oil prices at the beginning of the year coupled with the increase in Permian basin M&A and drilling activity, pushed companies in the upstream sector to raise a significant amount of equity in 2016
- Capital markets activity is expected to pick up in 2017 in the energy industry, building on growth of upstream M&A and private equity investments in the U.S.
Decreased liquidity in the bond markets was a result of investors becoming more risk-averse in a low commodity price environment, PLS said. That affected profit margins and increased the credit risk of energy related companies, which had an impact on funds raised through bond offerings. This decrease was met with a healthy increase in equity issuances, a 36% surge in amount raised over that in 2015.
Oil price accounts for much of the deal market volatility as it began descending from July 2014 highs of $100-plus per barrel and accelerated in November 2014 when OPEC decided to open the taps to gain market share, the research firm said. This resulted in prices plummeting to a low of $27 per barrel in February 2016.
“Two years after OPEC’s attack on oil prices began, both OPEC and non-OPEC countries agreed to cut production beginning January 1, 2017 — a decision that is expected to further boost oil prices this year,” PLS said.
2016 in Review
Deal counts for equity and bond offerings increased by 7% in 2016 to 346 deals versus 322 in 2015 but also fell shy of 2014’s 410 deals. Note, these deal counts do not include at-the-market equity offerings. On the other hand, total deal amount decreased by 5% in 2016 to $186 billion from $196 billion in 2015 and $25 billion lower than 2014’s $211 billion of bond and equity deal amount issued.
| 2016 Energy Bond and Equity Issuances | ||||
| Year | Deal Amount ($ billion) |
Deal Count | ||
| 2011 | $119 | 276 | ||
| 2012 | $196 | 382 | ||
| 2013 | $193 | 432 | ||
| 2014 | $211 | 410 | ||
| 2015 | $196 | 322 | ||
| 2016 | $186 | 346 | ||
| Source: PLS. Capitalize. | ||||
E&Ps raised equity to grab inexpensive assets, many multiple issuances
PLS said Capitalize™ saw upstream companies coming out with multiple offerings in 2016, fueled substantially by the need to raise money to act upon opportunities to grab inexpensive assets.
Some companies go years without doing even one secondary offering, PLS observed. Callon Petroleum raised about $1.3 billion across four raises last year. Parsley Energy and Synergy Resources issued equity three times. Matador Resources, Rice Energy (plus one for its midstream subsidiary), Resolute Energy, Gulfport Energy, PDC Energy, SM Energy and Ring Energy all had two offerings, the Capitalize™ report said.
Return of the SPAC
After an absence from the US energy equity landscape, 2016 saw the IPOs of two blank-check companies willing to wait before pouncing on reasonably-priced oil assets. One of them, Silver Run Acquisition Corp., became Centennial Resource Development in September and the other, KLR Energy Acquisition Corp., combined with Tema Oil & Gas to form Rosehill Resources. This transaction is expected to close in the first half of 2017.
Good execution on Chapter 11 restructuring support agreements
Most of the companies that filed for bankruptcy last year came to court with at least a preliminary restructuring support agreement in hand, enabling them to get through the process faster.
“Those that hadn’t garnered strong support from creditors and other stakeholders from the onset, like Energy XXI, waited over eight months to get through the process. Swift Energy, like its name suggests, got through in just three months,” according to PLS.
Tender offers still hot
Chesapeake Energy and Devon Energy undertook massive waterfall tender offers on several series of outstanding debt last year. Tender offer activity among overburdened oil companies was consistent throughout the year, continuing the momentum begun in 2015. Tendered debt was swapped for new debt, cash or a combination. Most everyone paid an early tender premium of $30 per each $1,000 of debt tendered. Many companies did equity or new debt raises for cash to pay for the tender offers.
“We’re spending within our means”
PLS observed that there are many CEOs and CFOs who uttered these words or something similar in more press releases and on more conference calls this year, beating out “rightsizing” and “headwinds” for the most overused energy capital phrase of the year. Many companies used 2016 as an experiment to ratchet capex down below expected cash flow rather than borrow more to fund capex.
2016 equity offerings
The increase in 2016 equity offerings was mainly the result of the large increase in deal amount raised by companies in the upstream, midstream, and services sectors which helped keep 2016 equity deal amount raised close to the levels seen in 2015. Largest equity issuance increases over 2015 were in the upstream and services sectors at 69% and 342% respectively, PLS said.
| Top 10 Energy Upstream Equity Offerings in 2016 | ||||||||
| Company | Lead Bookrunner | Lead Bookrunner Allocation |
Total Number of Bookrunners |
Deal Amount ($ Million) |
||||
| Anadarko Petroleum | JP Morgan | 100% | 1 | $1,876 | ||||
| Pioneer Natural Resources | BAML | 32% | 4 | $1,404 | ||||
| Devon Energy | Goldman Sachs | 70% | 15 | $1,294 | ||||
| Concho Resources | Credit Suisse | 39% | 24 | $1,155 | ||||
| Marathon Oil | Morgan Stanley | 78% | 7 | $1,109 | ||||
| Southwestern Energy | Credit Suisse | 35% | 24 | $1,085 | ||||
| Diamondback Energy | Credit Suisse | 53% | 23 | $1,000 | ||||
| Rice Energy | Barclays | 60% | 2 | $1,020 | ||||
| Encana | Credit Suisse | N/A | 4 | $1,000 | ||||
| Hess | Goldman Sachs | 35% | 17 | $975 | ||||
| Source: PLS. Capitalize. Does not include overallotment shares. | ||||||||
Lead equity bookrunners
JP Morgan was the most active bookrunner in the upstream sector for equity offerings with deal amount share of $6.1 billion or 19% of total upstream deals, PLS said. Barclays took the lead in midstream with a share of $3.2 billion (24% of midstream). Wells Fargo was the most active in downstream at a share of $0.4 billion (27% of downstream). Morgan Stanley took the lead in the services sector with $1.2 billion or 27%.
| Top 10 US Banks for U.S. Energy Equity Deals in 2016 | ||||||||||||
| (Allocated Deal Amount $ Millions) | ||||||||||||
| Bank | Upstream | Midstream | Downstream | Services | Integrated | Total | ||||||
| JP Morgan | $6,123 | $211 | $75 | $747 | $254 | $7,411 | ||||||
| Credit Suisse | 5,558 | 263 | 0 | 408 | 0 | $6,229 | ||||||
| Barclays | 1,662 | 3,191 | 228 | 644 | 0 | $5,724 | ||||||
| Goldman Sachs | 3,318 | 436 | 15 | 293 | 0 | $4,063 | ||||||
| Morgan Stanley | 1,720 | 282 | 87 | 1,163 | 68 | $3,320 | ||||||
| RBC | 649 | 2,064 | 9 | 35 | 147 | $2,903 | ||||||
| BAML | 1,878 | 77 | 107 | 127 | 147 | $2,335 | ||||||
| Citi | 1,557 | 349 | 54 | 83 | 147 | $2,190 | ||||||
| Wells Fargo | 1,380 | 167 | 352 | 229 | 0 | $2,128 | ||||||
| TD Securities | $387 | $1,199 | $9 | $16 | $372 | $1,983 | ||||||
| Source: PLS. Capitalize. | ||||||||||||
2016 bond issuances
Low commodity prices at the start of 2016 tightened liquidity in the bond markets. As a result 2016 deal amount decreased by 15% to $133 billion in 2016 from $156 billion in 2015. Upstream bond issuances saw a minor uptick of 1% in deal amount raised over 2015 to $46 billion. Largest increase in bond issuances was seen in the downstream sector, increasing over 2015 amount by 67% to $16 billion. Midstream, integrated and services sectors saw decreases ranging from 22% to 49% over levels in 2015.
Lead bond bookrunners
JP Morgan took the lead allocation in the bond arena, capturing the largest market share in three out of the five energy sectors that PLS covers; this was in upstream, midstream and the integrated sectors.
On average, the bank captured a 13% market share in each of those sectors. Bank of America Merrill Lynch captured the largest market share in downstream at 8%. Morgan Stanley replicated its success in equity offerings in the services sector by capturing the largest bond share in that sector at 12%.
| Top 10 US Banks for U.S. Energy Bond Deals in 2016 | ||||||||||||
| (Allocated Deal Amount $ Millions) | ||||||||||||
| Bank | Upstream | Midstream | Downstream | Services | Integrated | Total | ||||||
| JP Morgan | $6,543 | $2,087 | $1,260 | $370 | $5,259 | $15,520 | ||||||
| BAML | 5,189 | 1,216 | 1,430 | 126 | 4,293 | $12,253 | ||||||
| Citi | 2,317 | 976 | 661 | 576 | 4,447 | $8,976 | ||||||
| Barclays | 1,719 | 1,056 | 231 | 308 | 2,933 | $6,247 | ||||||
| Morgan Stanley | 982 | 307 | 598 | 1,293 | 2,933 | $6,112 | ||||||
| Wells Fargo | 1,661 | 1,608 | 942 | 575 | 1,130 | $5,916 | ||||||
| Deutsche Bank | 1,143 | 1,741 | 240 | 588 | 2,009 | $5,721 | ||||||
| Mizuho | 1,793 | 1,328 | 728 | 66 | 226 | $4,141 | ||||||
| RBC | 648 | 794 | 373 | 358 | 1,949 | $4,121 | ||||||
| Credit Suisse | $1,868 | $615 | $865 | $411 | $0 | $3,760 | ||||||
| Source: PLS. Capitalize. | ||||||||||||
Looking forward: dry powder is available for the right deal
At the beginning of 2016, over $100 billion of dry powder private equity capital was available. Much of this remains available a year later, supplemented by a receptive Wall Street quickly supporting overnight secondary equity raises to fund the largest deals, according to PLS.
PLS anticipates more capital coming forward as IPO markets open up in 2017
As drilling and oil prices pick up in the U.S., PLS expects capital markets to pick up pace in 2017.
“Already we have seen two IPOs, 17 follow-on offerings and 13 bond offerings in the beginning of 2017,” PLS said. “An expected rise in oil prices, increased U.S. M&A activity and private equity funds looking to monetize unrealized investments, the outlook for energy capital markets activity in 2017 looks promising.”
Access the PLS Inc. Capitalize presentation “U.S. Energy Capital Markets – A Look Back at 2016” here.
PLS is a sponsor of EnerCom’s oil and gas conferences including the EnerCom Dallas oil and gas investment conference Mar. 1-2, 2017. PLS Energy Advisory Group in 2016 closed over 35 oil and gas deals across the globe. The PLS product suite includes the Global M&A Database, docFinder and Capitalize, and the firm publishes specialty industry reports.
Register for EnerCom Dallas at the conference website.


