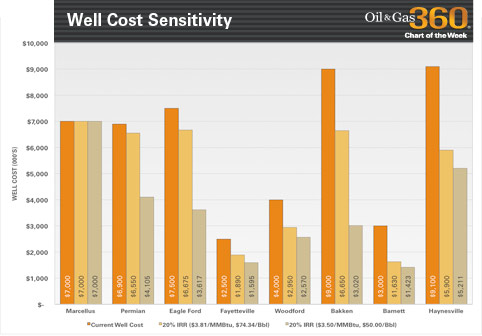
EnerCom’s Analytics Team ran an analysis of well costs for various basins. The “Current Well Costs” bar shown in the chart represents an average of actual 2014 well costs for a group of E&P companies operating in each basin. The next bar represents the analysts’ adjusted well costs to reflect a 20% IRR at the price level last month which was $3.81 gas and $74.34 oil. If the prices go to 3.50 gas and $50 oil, the third bar indicates the well cost that an operator would need to meet in order to maintain the 20% IRR.
- Home
- E&P and Oilfield Services
- A&D
- Finance
- Energy
- 360 Energy Expert Network
- Women in Energy
- 360 Industry Leadership Insights
- Conference Replays
- EnerCom Denver 2023 Replays – Premium Subscribers
- EnerCom Denver 2022 Replays – Premium Subscribers
- The Oil & Gas Conference 2021 Replays – Premium Subscribers
- The Oil & Gas Conference 2020 Replays – Premium Subscribers
- EnerCom Dallas 2023 Replays – Premium Subscribers
- EnerCom Dallas 2022 Replays – Premium Subscribers
- Enercom Dallas 2021 Replays – Premium Subscribers
- The Energy Venture Investment Summit 2022 Replays – Premium Subscribers
- The Energy Venture Investment Summit 2021 Replays – Premium Subscribers
- Login / Subscribe


