Cushing storage goes above 71,409,000 barrels of oil
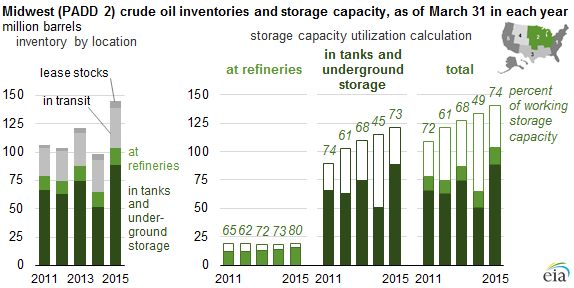
The Energy Information Administration (EIA) released its biannual Working and Net Available Shell Storage Capacity Report, providing a picture of refinery and storage utilization throughout the United States. The report covers utilization in every Petroleum Administration Defense District (PADD) across the U.S., but the Midwest (PADD2), which includes the storage facilities at Cushing, Oklahoma, saw some of the highest levels of storage and utilization, with 144.7 MMBO in storage as of March 2015, according to the EIA.
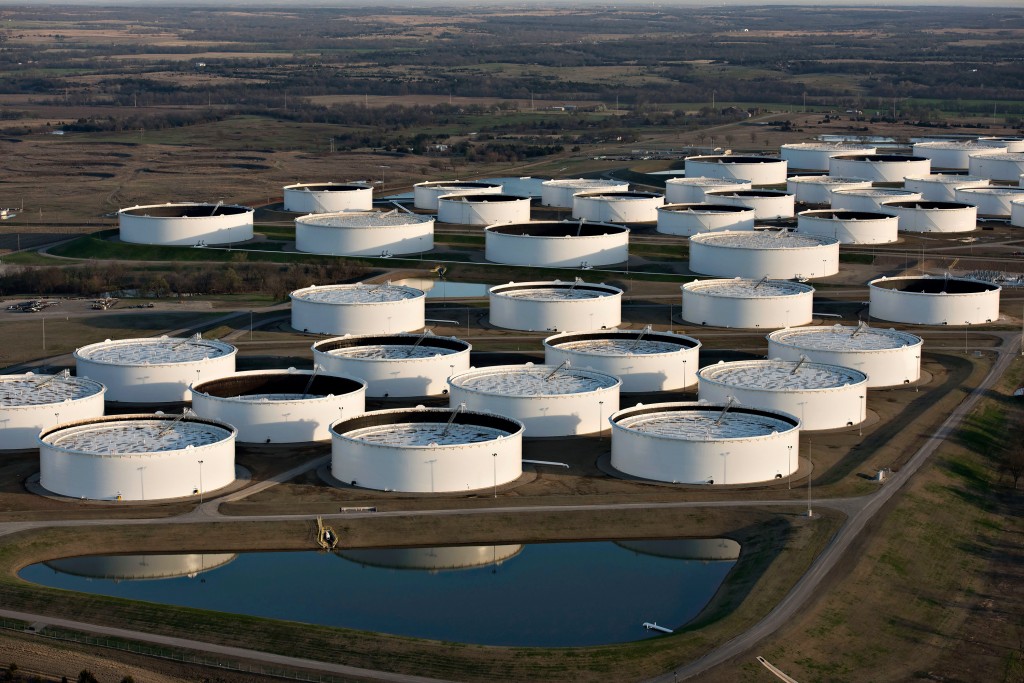
The crude oil storage facility at Cushing, Oklahoma, is home to crude oil from across the U.S., as well as Canadian crude oil imported from our neighbors to the north. It is difficult to say exactly how much crude oil comes from Canada, with estimates ranging from 300 MBOPD to more than 800 MBOPD, according to experts who spoke with Oil & Gas 360®.
Regardless of its source, the amount of crude oil at the Cushing facilities has skyrocketed in the last six months to nearly 71 million barrels of oil, representing 49% of the overall crude oil storage in PADD 2. Cushing utilization hit 81% in the EIA report for March 2015, up 56% from the September 2014 report and 43% higher than March 2014.
Many companies decided to sell their production on futures markets in order to gain a more favorable price after the value of crude oil plummeted in the second half of last year. This production was sent to storage facilities across the U.S., with a large portion ending up in PADD 2’s Cushing facilities.
The enhanced crude storage data is part of the EIA’s continuing studies regarding the consequences of exporting our domestic crude. The Administration was recently granted permission from the White House to expand its coverage network, which will provide a greater, more thorough understanding of hydrocarbon production and its associated grades.
“When we combine [the new crude oil data] with our data on refining capacity and utilization figures, that will help answer the question of whether or not bottlenecks and refining capacity will lead to lower prices or shut-ins of domestic crude oil,” said Adam Sieminski, Administrator of the EIA, in an interview with Oil & Gas 360®.
Utilization in the Midwest hits record highs
Refinery storage at PADD 2 reached 80% utilization in March 2015, the highest storage utilization rate ever observed by the EIA since it started collecting data on storage capacity in 2011.
PADD 2 storage tanks and underground facilities reached 73% utilization in March 2015, nearly equal to levels in 2011, when tank and underground storage capacity utilization was 74%. Since 2011, tank and underground storage utilization fell steeply, going as low as 45% in March of 2014, before shooting back up nearly 30 percentage points in a year in the EIA’s most recent report.
Combined utilization of storage at refineries and storage facilities in PADD 2 hit a record high at 74% in March 2015 as well. When the EIA started collecting data on storage utilization in 2011, combined use was 72% of working capacity. It lowered over the years, going as low as 49% in March of 2014 as companies took advantage of oil prices hovering in the $100 range.
Utilization up across the U.S.
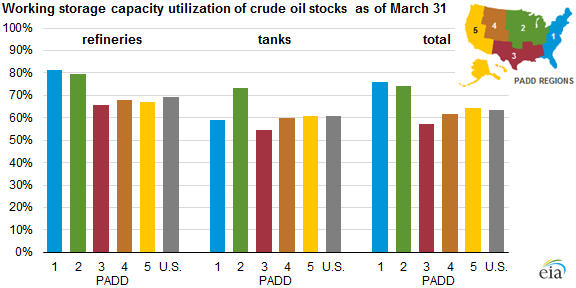
Overall U.S. utilization rates rose in the six months between the EIA’s reports, with total crude in bulk terminals reaching 983,330 MBO in March 2015 from 973,331 MBO in September 2014. Oil in crude tank farms like Cushing was up to 390,534 MBO from 372,879 MBO in the same time frame, while crude in Refineries fell slightingly to 608,223 MBO from 610,447.
The utilization rate for total working storage capacity at refineries hit 57% in March, up 2% from September, while utilization of total working storage capacity at crude tank farms rose to 61% from 39% in September of last year.


