The drop in crude oil prices is well documented, but will natural gas follow suit with winter approaching?
The West Texas Intermediate spot prices closed at a two year low of $80.52 yesterday, down a total of $19.90 in the last three months (22.9% overall). Price cuts from Saudi Arabia have prompted the market to focus solely on supply news rather than political news, a German trader told Bloomberg on Thursday.
The natural gas market, on the other hand, is not expected to board the same price rollercoaster as its partner fuel source. The National Oceanic and Atmospheric Administration (NOAA) says a repeat of last year’s frigid winter is “unlikely,” when frozen pipelines and stalled operations forced spot prices as high as $123 per MMbtu. Rather, the NOAA forecasts a warmer than normal winter in the western and northeastern United States, while the southeast may receive a cooler than normal season.
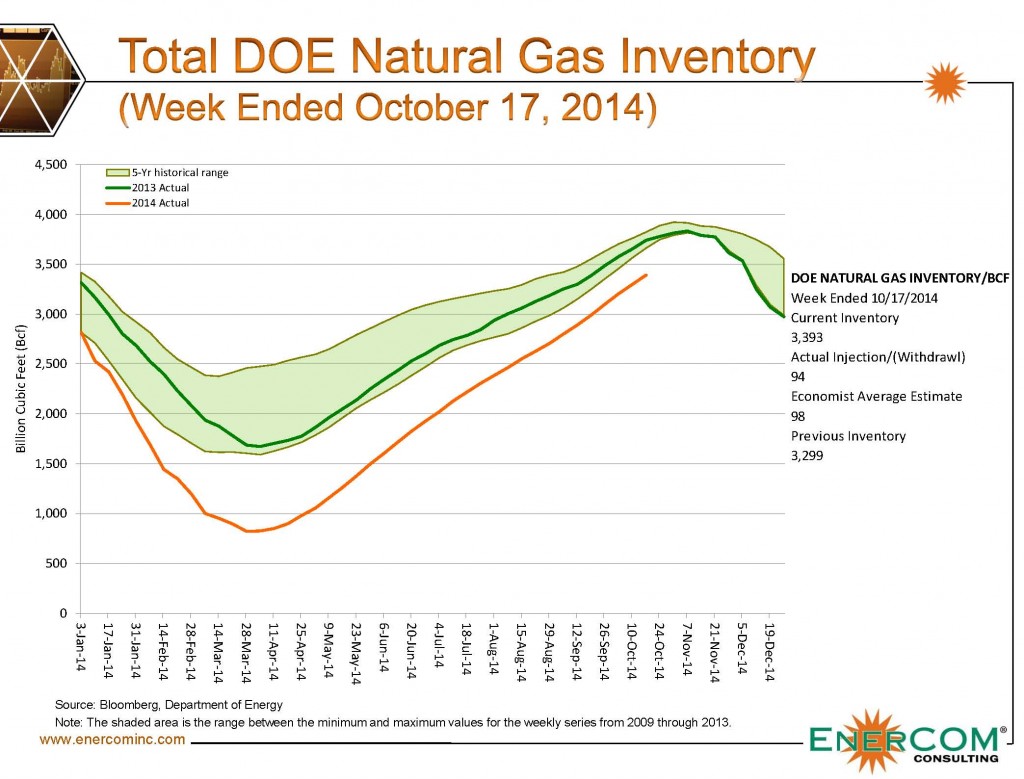
The winter of 2013-14 cut into natural gas storage levels, leaving the markets unsure if supply could recover in time for the next withdrawal season. Storage levels were 55% below the five year average at the end of March. Today, roughly seven months later, natural gas levels are just 9% below the five year average. In the time period, 2014 has averaged builds of 88 Bcf per week, compared to the five year average of a 66 Bcf build per week. If the gains continue its trend through the end of inventory build season, the total will be just 5% below the five year average.
“Most people probably didn’t envision we’d have such a fast restocking of natural gas,” said Darwei Kung, manager of Deutsche Bank AG’s DWS Enhanced Commodity Strategy Fund, in an interview with The Wall Street Journal. The gains are a testament to the ever-increasing rate of hydrocarbon production in the United States. Production from February to March in 2014 increased by 12% on a month-over-month basis as the effects from winter finally began to thaw, according to the Energy Information Administration.
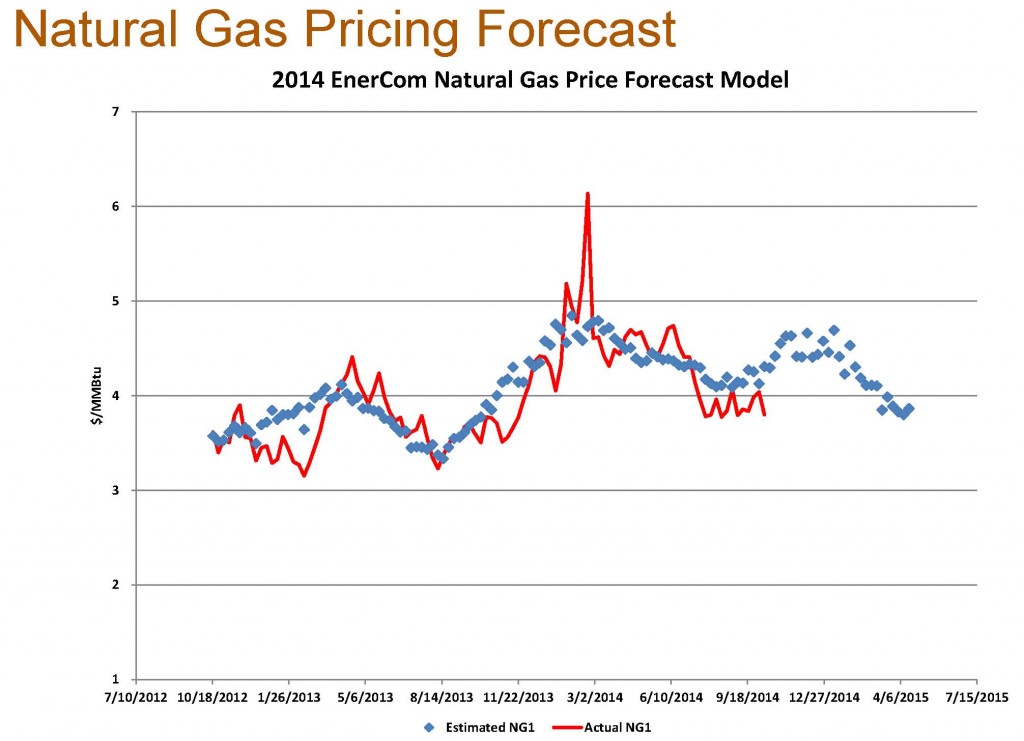
Barring the unforeseen freezes that plagued the market last year, EnerCom anticipates natural gas prices to be higher in 2014 than the prices forecast in 2013. The EnerCom model combines 18 different variables to determine future gas prices. The average price for October through December in 2014 is expected to average $4.45/MMBtu, compared to 2013’s estimate of $4.15/MMBtu. Year-end 2014 prices are forecasted at $4.58, compared to 2013’s end price of $4.40.
In January through March, 2015 prices are projected at a midpoint of $4.22/MMBtu, with prices dropping below the $4.00 threshold by mid-March. Prices were consistently above that level in 2014 as gas inventories were limited, averaging a $4.68/MMbtu price in the three month span.
The Wall Street Journal expects gas prices to remain relatively low in its October 23 article titled “Natural-Gas Bulls: Better Luck Next Year.” Late 2015 will be a different situation, according to The Journal, due to coal-fired power plant shutdowns stemming from stricter emissions imposed by the Environmental Protection Agency. A total of 60% of current coal-fired plants are expected to be decommissioned by 2020. Although the article doesn’t believe a jump in gas prices is guaranteed, the seasonal swings will be more extreme due to the increasing dependence of the plentiful resource.
[sam_ad id=”32″ codes=”true”]
Important disclosures: The information provided herein is believed to be reliable; however, EnerCom, Inc. makes no representation or warranty as to its completeness or accuracy. EnerCom’s conclusions are based upon information gathered from sources deemed to be reliable. This note is not intended as an offer or solicitation for the purchase or sale of any security or financial instrument of any company mentioned in this note. This note was prepared for general circulation and does not provide investment recommendations specific to individual investors. All readers of the note must make their own investment decisions based upon their specific investment objectives and financial situation utilizing their own financial advisors as they deem necessary. Investors should consider a company’s entire financial and operational structure in making any investment decisions. Past performance of any company discussed in this note should not be taken as an indication or guarantee of future results. EnerCom is a multi-disciplined management consulting services firm that regularly intends to seek business, or currently may be undertaking business, with companies covered on Oil & Gas 360®, and thereby seeks to receive compensation from these companies for its services. In addition, EnerCom, or its principals or employees, may have an economic interest in any of these companies. As a result, readers of EnerCom’s Oil & Gas 360® should be aware that the firm may have a conflict of interest that could affect the objectivity of this note. The company or companies covered in this note did not review the note prior to publication. EnerCom, or its principals or employees, may have an economic interest in any of the companies covered in this report or on Oil & Gas 360®. As a result, readers of EnerCom’s reports or Oil & Gas 360® should be aware that the firm may have a conflict of interest that could affect the objectivity of this report.
Analyst Commentary
KLR Group (10.23.14)
Storage overview
The EIA reported a 94 Bcf storage build, 6 Bcf below our 100 Bcf estimate and 4 Bcf below the 98 Bcf build consensus.
The East region showed a 47 Bcf build, the Producing region showed a 39 Bcf build and the West region showed an 8 Bcf build. Storage stands at 3,393 Bcf, ~9% below last year and ~9% below the five-year average. The data suggests the market is ~1 Bcfpd oversupplied on a weather-normalized quarterly moving average basis. Notably, gas was up ~$0.04 following the storage report.
Supply/demand trends
Over the past four weeks, gas-fired power demand has been trending up ~1.5 Bcfpd y/y, while industrial demand has been averaging up ~1 Bcfpd y/y over the past month. Further, the data suggests gas-fired power demand is up ~1.2 Bcfpd y/y on a weather-normalized monthly moving average basis.
Over the past month, Canadian net imports are up ~0.5 Bcfpd y/y, Mexican net exports are up ~0.3 Bcfpd y/y, and LNG send-out was down ~0.2 Bcfpd y/y.
In ’14, we anticipate gas-fired power generation should decline approximately 0.5 Bcfpd given the remaining transitory gas-to-coal power switching occurred in the first quarter with ~$5 gas prices.
Recent EIA U.S. supply data indicates July production averaged ~70.4 Bcfpd. We anticipate U.S. supply exits ’14 at ~71.4 Bcfpd. Rig activity is currently ~330 rigs and we expect an average of ~330 rigs in ’14.
Thesis (as of October 9, ’14)
With the expectation of a ~330 average gas rig count in ’14, U.S. onshore supply should increase almost 4 Bcfpd this year versus our earlier expectation of ~3.8 Bcfpd. This implies stabilizing gas well/rig productivity and suggests a ~300 gas rig count is sufficient to maintain market equilibrium.
In ’13, we observed 3+ Bcfpd of associated gas production growth (1,373 oil rigs). Assuming an average 1,530 oil rig count this year, we expect 4+ Bcfpd of growth in gas production related to oil-directed drilling.
In ’15, a ~300 gas rig count and ~1,600 oil rig count should comfortably maintain gas market balance, reconcile with a ~$4 NYMEX gas price signal and correspond to gas-weighted E&P’s modestly outspending cash generation.


