Just because it’s cyclical, doesn’t mean every cycle is the same
They say history repeats itself, and given the cyclical nature of the oil and gas business, many look to the past when trying to guess what is coming next, but past experience doesn’t always offer an exact model for the present.
Much has changed between the 2008 oil and gas downcycle and the one the industry is currently working through today. The drop in oil prices that started in 2008 took place against the backdrop of the Global Financial Crisis, aka The Great Recession. Economies all around the world sputtered to a halt, and demand for oil dropped. Lehman Brothers filed for bankruptcy protection on September 15, 2008. It was the all-time largest bankruptcy filing.
Oil prices dropped from historic highs of $144.29 in July 2008, to $33.87 five months later. OPEC, the world’s traditional “swing crude oil producer,” took its traditional actions, cutting production by 16% in eight months to bring stability to global prices, which was led primarily by the group’s largest producer, Saudi Arabia. Crude oil consumption and production dropped by 1.5% and 1.2%, respectively, before coming back to parity from 2008 to 2010. U.S. producers pulled back on drilling operations until prices began to improve, switching from conventional drilling to horizontal drilling following the 2008 crash. And except for the banks and car companies, there wasn’t much going on at the bankruptcy court house by the E&P or OilService (OFS) companies.
In aggregate, debt-to-EBITDA for the E&P companies was approximately 1.6x, and the average capital efficiency (EBITDA per BOE divided by finding and development costs per BOE) was 230%, while for the OFS sector debt-to-EBITDA was 0.9x, while capital intensity (capital expenditures divided by EBITDA) was 62%. The companies, in general, had the cash and balance sheet to work through another downward descent in the 7th commodity cycle since 1981.
Today’s cycle, which showed the same precipitous drop in prices, took place in a different context, and the results are fundamentally different as well.
Oil fell for longer than before, but rebounded more quickly after hitting bottom. Saudi Arabia, having unfavorable memories of the last cycle when Russia and Iran chose to keep pumping oil and gaining a larger portion of the market as it was cutting production, this time decided that market share was more important than cash flow. Despite consumption and production both continuing to rise, there was an evident imbalance that produced a swift downward push on global crude oil prices.
Despite actions taken by non-OPEC producers and OFS to rein in spending and production increases, this cycle was different, with more than 75 companies filing for bankruptcy protection. For U.S. E&Ps, debt-to-EBITDA in 2014 was 2.6x, while capital efficiency was 197%. For the OFS sector, debt-to-EBITDA ballooned to 2.2x and capital intensity rose to 82%.
Oil prices recover further, faster
The last time oil went from the low $30 per barrel range to more than $50 was from December 2008 to April 2009 when it took 126 days for WTI prices to go from $33.87 on December 19, 2008, to $51.55 on April 24, 2009.

Source: Bloomberg 2008 price recovery
While it took just over four months for prices to recover to $50 per barrel during the 2008 cycle, WTI prices in 2016 came back from even lower lows, and more rapidly, during this most recent cycle. From February 11, 2016, to June 8 of the same year, the price of the U.S. benchmark crude rose 95.5%, from $26.21 to $51.23. In just 89 days, WTI appreciated $25.02 compared to a price increase of $17.68 per barrel in 126 days during the 2008 cycle.
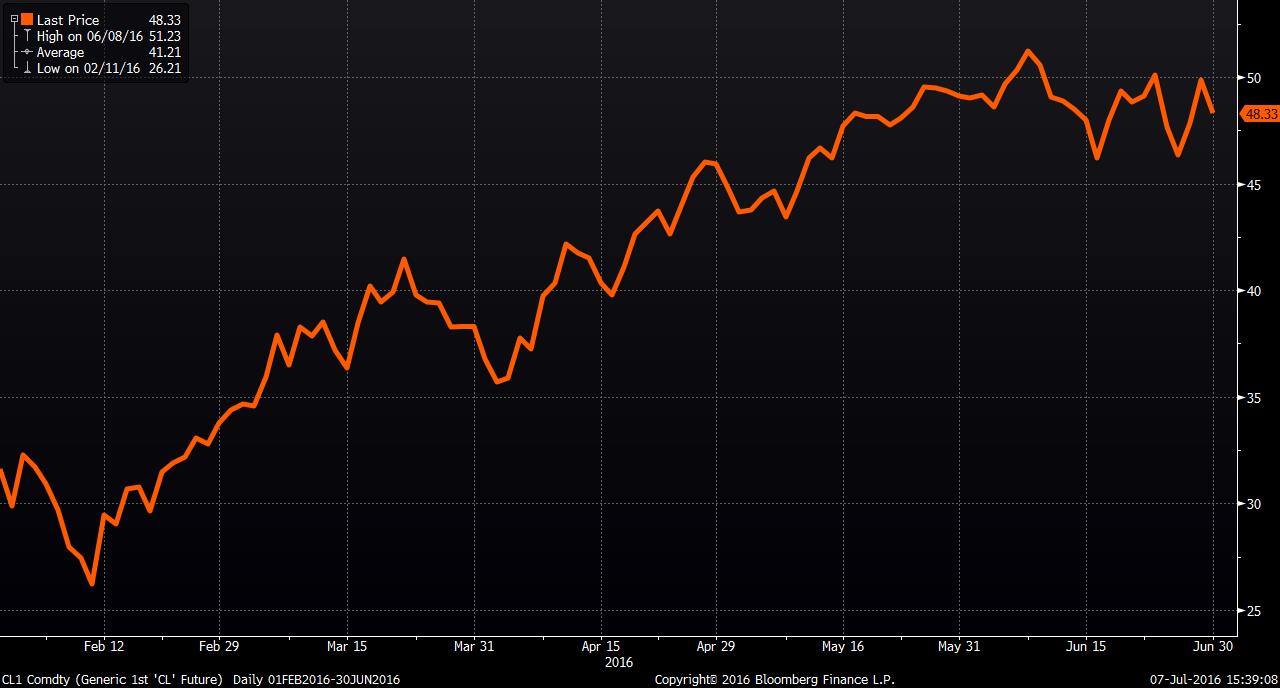
Source: Bloomberg 2016 price recovery
But there has been a catch.
Despite rising further, faster, WTI has hit a roadblock during this cycle that did not appear following the 2008 crash in prices. Since peaking above $50 per barrel, WTI prices have hit a ceiling, fluctuating in the mid-$40 to mid-$50 per barrel range. During the 2008 downcycle, prices rose at a slower pace, but they continued to pick up steam, increasing steadily to over $100 per barrel and then staying above $75 per barrel until the end of 2014 when they crashed again.
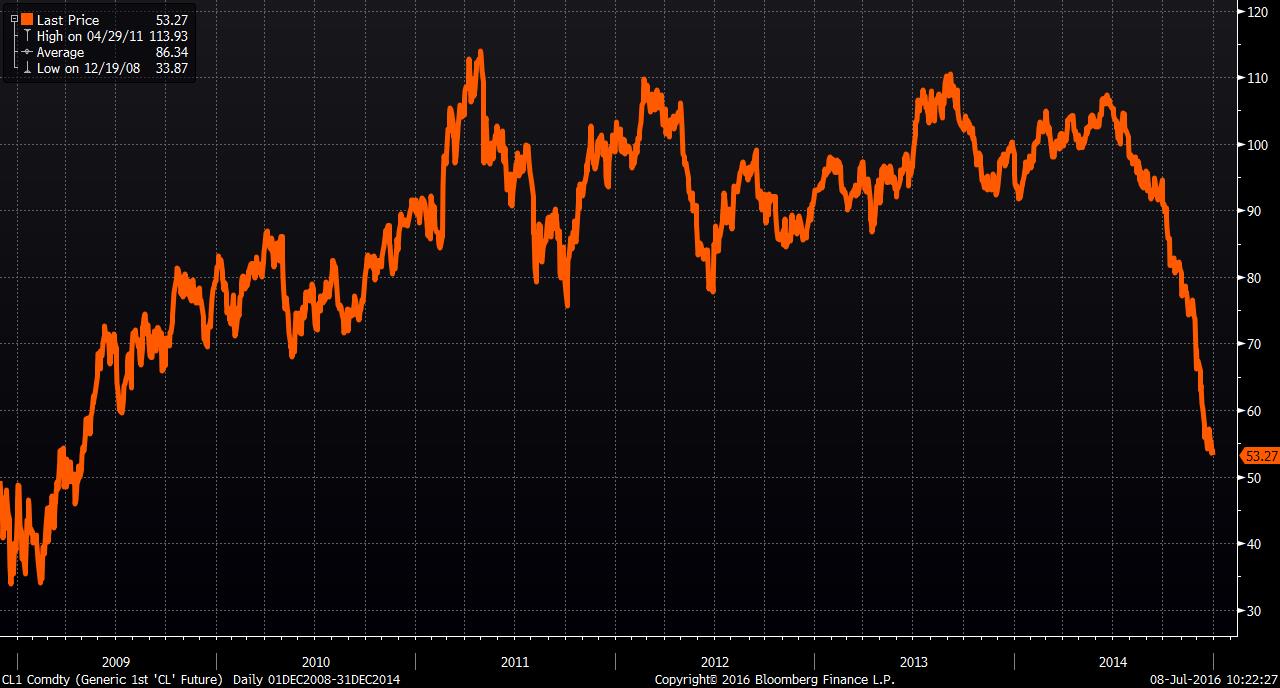
Source: Bloomberg Oil price recovery from 2008 to 2014
Drilling for shale took off after 2004. While the early years represented a period of exploration and over-exuberance, what was learned then is benefitting producers today. Drilling times are faster, completion of discreet zones are vastly improved, and the U.S. and Canadian capital markets are robust for the companies with superior assets and results. However, the market does fret that U.S. shale operators will start bringing their production back online, effectively capping WTI’s gains, as crude oil prices reach a price target of more than US$50 to US$60 (depending on asset location and quality). And while U.S. production is showing steady declines, output remained higher for longer than many analysts expected, creating record-setting stockpiles of crude oil at Cushing (more than 11% above the average 5-year high mark at their peak for the week ended April 29, 2016), leaving little room for the oil currently being produced.
Markets are working off a crude oil bubble, not dissimilar to the natural gas bubble that was prevalent in the 1990s. While working off the glut will take more than just lower production, U.S. consumption also needs to soak up the overhang in already-produced crude oil, and the U.S. producer has to find a way to join the global export market of crude oil.
This cycle has been longer, too
While WTI prices rebounded more quickly after finding their bottom, the overall cycle has been much longer this time around than it was in 2008. Looking at the full cycle, peak to trough, and back up again, oil prices in 2008 recovered faster than today.
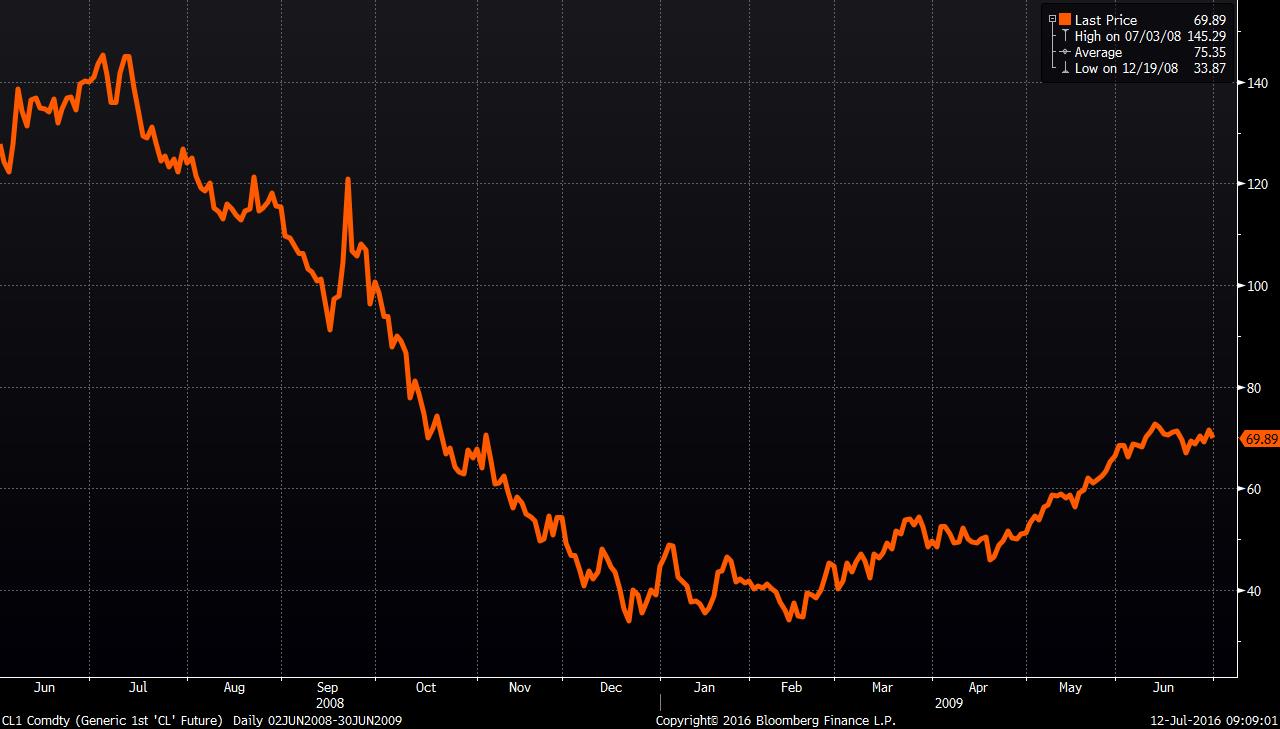
Source: Bloomberg WTI Peak to trough and back above $50 per barrel in 2008-2009
From the historic highs in July 2008 of $144.29 per barrel, oil crashed, then broke above $50 per barrel in 42 weeks, or 294 days. Using Thanksgiving Day 2014 as the starting peak for this most recent cycle, since it was the day OPEC changed its policy and pulled the floor out from oil prices, it took almost twice as long for prices to bottom out and return to levels above $50 per barrel. From the day before Thanksgiving 2014, November 26, to the day WTI rose above $50 barrel in June took 567 days.
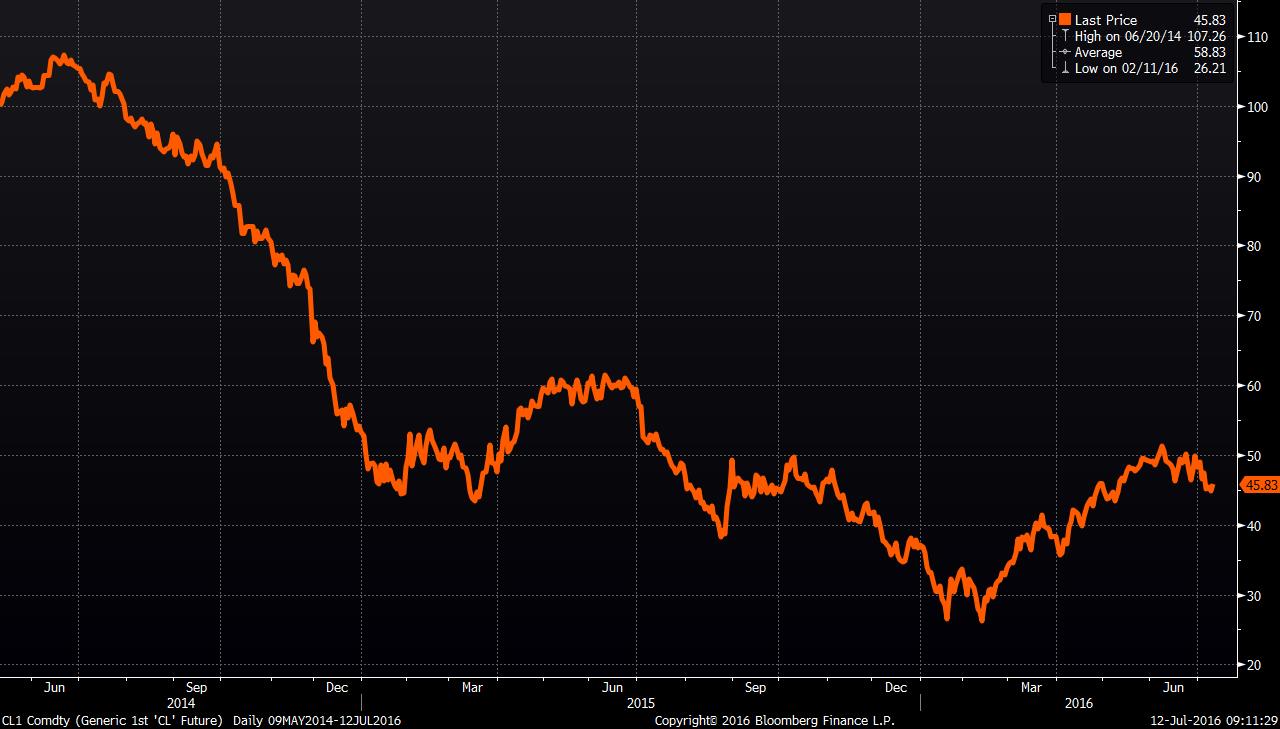
Source: Bloomberg WTI Peak to trough and back above $50 per barrel 2014-2016
The production just kept coming
Another major change between the two cycles was the reaction from the world’s producers. In 2008, OPEC cut production by more than 5 MMBOPD in response to lower prices, trying to stabilize markets by decreasing the amount of available crude.
OPEC production went from a high of 32.8 MMBOPD in July 2008, to 27.7 MMBOPD in March 2009 as the group cut back its output.
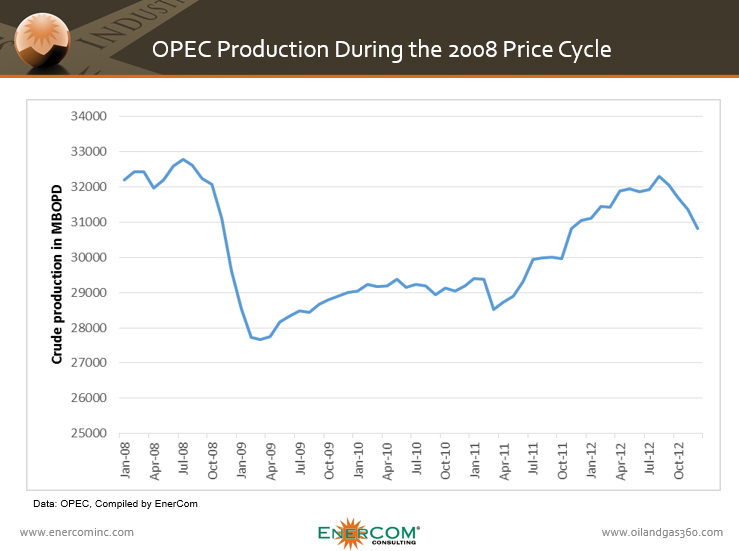
As part of OPEC’s stated mission to “ensure the stabilization of oil markets in order to secure an efficient, economic and regular supply of petroleum to consumers, steady income to producers and a fair return of capital to those investing in the petroleum industry,” the group decided to act as the swing producer and lower the amount of oil it was putting into the market. By the end of February, prices began to climb higher.
In order to act as a swing producer, OPEC must maintain spare capacity, and be willing to reduce production, in order to influence the market. If prices begin to spike, the group could tap its excess capacity to meet demand and lower them. Conversely, it has the decision-making power to lower production as it did during the 2008 cycle. When OPEC was acting in this role, Saudi Arabia was forced to shoulder most of that burden, however, as many other members of the group simply continued producing despite the agreement.
Fast-forward five years to November 2014, and world markets expected a similar reaction from the group that had historically acted to stabilize the oil market. Instead, OPEC, led still by Saudi Arabia, made a major policy shift and announced that it would focus on defending its market share rather than oil prices.
Saudi Arabia was not interested in a repeat of the 2008 cycle, in which it bore the burden of cutting production, raising prices for other members who continued producing indiscriminately, and hurting its own bottom line.
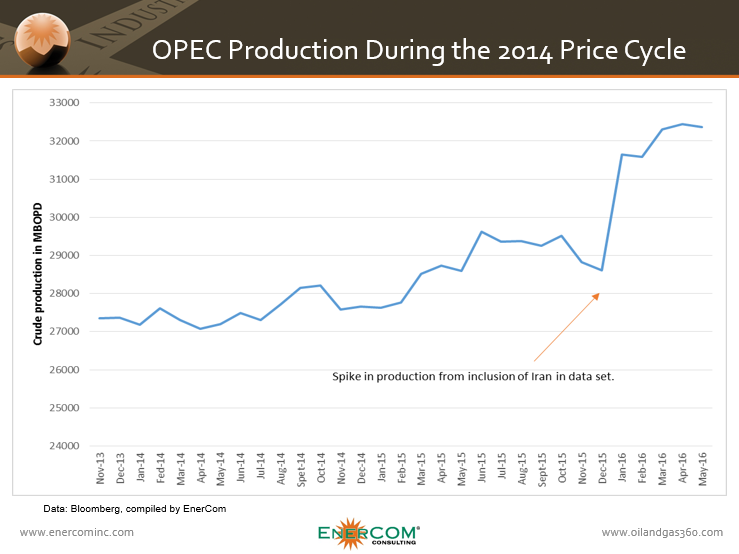
OPEC production began to climb rather than drop as the group fought to shut higher-cost U.S. shale producers out of the market. This was followed up with the lifting of international sanctions on Iran, which immediately began adding more production to OPEC’s total as the Islamic Republic looked to re-enter markets it had been shut out of following the implementation of sanctions.
Since removing its production cap, OPEC has continued to push output higher, even at the expense of its own members. Venezuela in particular is struggling with lower oil prices and inflation that is expected to reach 1,600% in 2017.
45% of OPEC’s increased production from November 2013, to June 2016, came from Iran, Iraq and Saudi Arabia. Over that period, OPEC increased its overall production more than 5.5 MMBOPD to 32.9 MMBOPD from 27.3 MMBOPD. While the decision to continue pumping was led by Saudi Arabia, the group’s leader only accounted for 12% of the production gains seen over that period, adding 0.7 MMBOPD to its production. Iraq made the most substantial gains, increasing production by 1.1 MMBOPD, or 20% of OPEC’s overall production increase, while Iran added 0.7 MMBOPD following the lifting of international sanctions, making up 13% of OPEC’s increased production.
Many of the group’s members have called for some form of new production agreement, with talks of a production freeze among OPEC and non-OPEC members like Russia bolstering prices from February to April of 2016. The deal fell through, however, when Iran said it would not cap its production before reaching 5 MMBOPD. It was hoped OPEC might make concessions for Iran, but ultimately Saudi Arabia decided it would not be a part of the deal without Iran, effectively tanking the whole agreement.
Consumption shows different patterns in this cycle as well
The differences between this cycle and the last extend outside of production, however. During the 2008 drop in oil production, consumption followed a similar path down before rebounding in 2010. This time around though, consumption continues to increase alongside output, but not at a pace that has been able to absorb excess production.
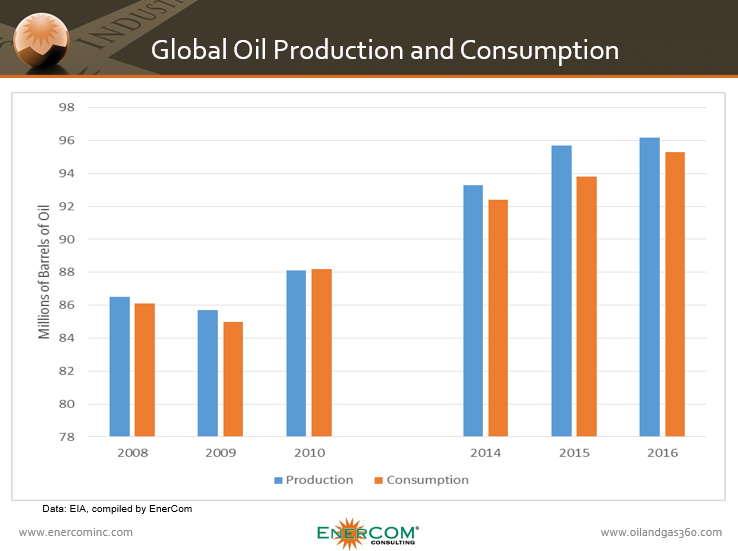
In 2009, oil consumption fell approximately 1.3% before coming back 3.8% in 2010. During this most recent cycle, consumption growth has remained positive, but it has not come back as dramatically as it did before. From 2014 to 2015, global oil consumption increased approximately 1.5%, with numbers from the first half of the year released by the EIA showing growth of 1.6% as oil prices look for support near $50 per barrel.
By 2010, oil consumption and production were nearly even, with consumption outpacing production by just 0.1 MMBOPD. This current downcycle shows an altogether different pattern. Even as prices improve from their lows in the beginning of 2016, markets have still been unable to absorb excess supply, with EIA data indicating that production still exceeds consumption by 0.9 MMBOPD, roughly 1% of total demand, in the first half of the year.
Supply and demand appear to be coming back to parity, with excess production down from 2% of total consumption in 2015, but with a great deal of glut still stored in storage tanks both on and offshore, whittling away the remaining excess could take time, making it difficult for oil prices to break through the resistance they have found above $50 per barrel. The EIA’s July 2016, Short-Term Energy Outlook (STEO) forecasts weaker demand as well, with the administration predicting 2016 demand will be 60 MBOPD less than it previously believed, while production declines 1.0 MMBOPD over the course of the year, pushing out the day supply and demand come into parity further into the future.
As a point of comparison, excess production during the last downcycle was roughly 1% at the peak of the supply and demand imbalance.
Drilling efficiencies have increased EURs in some plays by more than five-fold
OPEC’s decision to focus on its market share rather than price had major consequences for U.S. producers.
Lower prices forced companies to focus on producing efficiently from their core assets. This has left companies with the tools to produce more from their wells, and a backlog of DUCs and acreage that can still be drilled as prices begin to increase.
A report put together by EnerCom® in October 2008 looking at well economics for various shale gas plays around the U.S. found that companies were spending an average of $4.4 million on drilling and completion costs in the Haynesville, Marcellus, Fayetteville and Woodford for an average estimated ultimate recovery (EUR) of 4.1 Bcf.
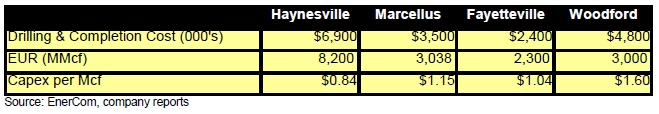
Today, companies are spending more on drilling and completions, but the EURs they realize are significantly higher. Based on information pulled from publicly available sources regarding shale gas operators, average drilling and completion costs are now roughly $5.0 million, or 14% more, but EURs average 7.8 Bcf, or 90% more than during the last cycle.
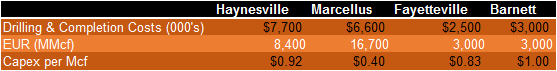
The changes between this cycle and the last are especially apparent in the Marcellus, where the average drilling and completion cost is $6.6 million, but EURs average 16.7 Bcf, more than five-times the average EUR indicated in EnerCom’s 2008 report.
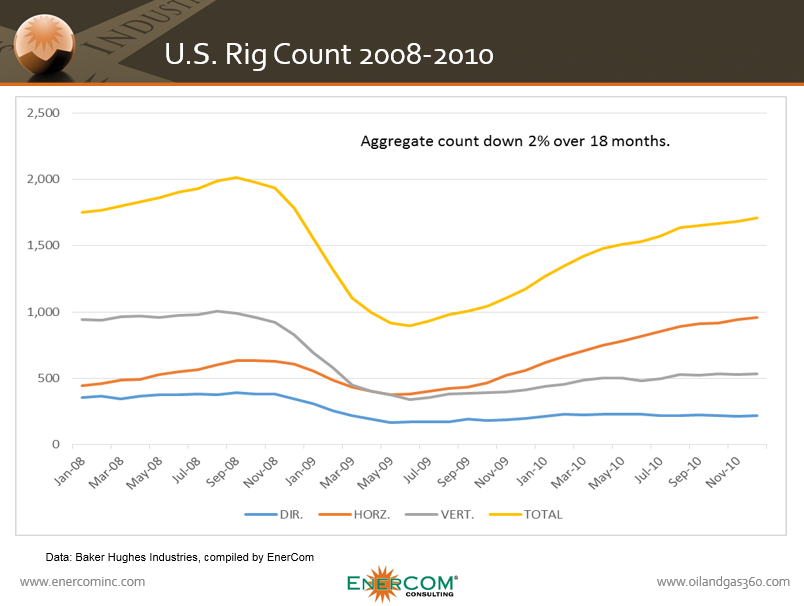
This efficiency has meant that, even as rig rates continue to idle well below the levels seen throughout much of 2014, production is still able to climb.
During the 2008 cycle, the number of rigs operating in the U.S. showed a steep drop before coming back in mid-2009 as consumption increased. While both production and consumption continue to show positive growth in the current cycle, the number of active rigs remains well below its previous peak as operators continue to realize higher EURs from their core acreage.

The changing landscape of the oil and gas industry
While commodity prices have proven to be cyclical, the background against which the drop in prices occurred in 2008 and 2014 are very different, and appear to have different implications.
In 2008, both production and consumption took a hit as global markets dealt with a world-wide financial crisis. It took more than four months for prices to recover from the low $30 per barrel range to over $50, and once they broke that mark, they continued climbing.
OPEC, which was acting as the global swing producer at the time, decided to cut back production as normally reliable purchasers stopped buying their oil. An article from October 2008, quotes then-OPEC President Chakib Khelil as saying the group reached consensus on cutting production by 1.5 MMBOPD “with little argument,” as the group looked to stabilize markets.
During this downcycle, however, the market is fundamentally different. Oil prices recovered even more quickly than before, but they haven’t been able to sustain those gains as concerns over a global glut persists. Consumption continues to grow, but production still outpaces demand at a rate similar to the supply and demand imbalance seen at the height of the 2008 downturn.
As OPEC works to hold on to its share of the market, the group has cast off its role as the swing producer, leaving it with little excess capacity to influence markets. And even if OPEC wanted to put the cat back in the bag and resume its role as swing producer, it appears that disagreements between Saudi Arabia and Iran have become too divisive for the group to reach clear consensus on future deals.
The role of swing producer was unwilling pushed on U.S. companies as oil prices began to plummet. U.S. companies were not able to produce economically, forcing them to shut-in production, much like Saudi Arabia and the rest of OPEC did in 2008. But the U.S. will not be able to act like a swing producer moving forward.
U.S. operators are prohibited from colluding on prices through anti-trust laws, and lack the collective decision-making authority of a cartel, meaning they will not be able to influence price. Instead, these companies will continue to react to prices, adjusting their production to meet market signals, rather than the other way around.
A large inventory of uncompleted wells are waiting for prices to make them economic, while any substantial increase in prices opens up the possibility of drilling new acreage for operators that now have the experience to produce more hydrocarbons with less capital. James Wicklund, Managing Director of Energy Research at Credit Suisse, estimated back in May 2016 that there are (were) more than 3,200 DUCs (Drilled UnCompleted) wells waiting to be completed. About 80% of those DUCs are located in the Williston, Permian, Marcellus basins.
Even though consumption continues to grow, markets have more crude oil to absorb now than during the 2008 financial crisis, and U.S. operators stand ready to bring more to market as soon as the economics make sense. No one has decided to pick up the mantle of swing producer left behind by OPEC in the wake of its Thanksgiving Day decision in 2014, and without that role filled, the market is left in a fundamentally different position.
It is tempting, and easy, to say this cycle will be like the last, but global trends in production and consumption, as well as the roles being played by the world’s major producers, have shifted drastically, making this cycle unlike the one that came before. What the future holds is impossible to say for certain, but it will look different from what followed the 2008 cycle.
