Penn Virginia Corp. (ticker: PVA) has spent the last few years building up its position in the Eagle Ford Shale of South Texas, and production increases combined with decreasing completion costs were the highlights of the company’s Q1’15 earnings release. The quarterly update, issued on May 11, 2015, reported average volumes of 24,721 BOEPD, with the Eagle Ford (EF) accounting for 21,390 BOEPD (87%) of the mix. On an absolute basis, production compared to Q4’14 climbed 16%, while EF volumes increased by 23%.
Penn Virginia currently holds approximately 145,500 gross (104,300 net) acres in the prolific play and believes it holds 12 years of drilling inventory. 2015 guidance is slated at $325 to $370 million, with approximately 96% slated for Upper Eagle Ford development. Production from South Texas has nearly doubled on a year over year basis.
 Eagle Ford Specifics
“While continuing to increase production, our primary focus has been on cutting well costs and improving our operational execution,” said H. Baird Whitehead, President and Chief Executive Officer of Penn Virginia, in a conference call following the release. “With 23 wells completed over the past 12 months, we feel that we have successfully de-risked the Upper Eagle Ford across much of our acreage and have achieved excellent average results.”
Completion costs for Eagle Ford wells in February and March are 25% less than those completed in October and November, with the average well in the region being placed online at a price tag of about $7.7 million. PVA management expects additional cost reductions as the company continues along its Eagle Ford learning curve. Two-string and three-string wells are expected to run about $7.0 and $8.3 million, respectively.
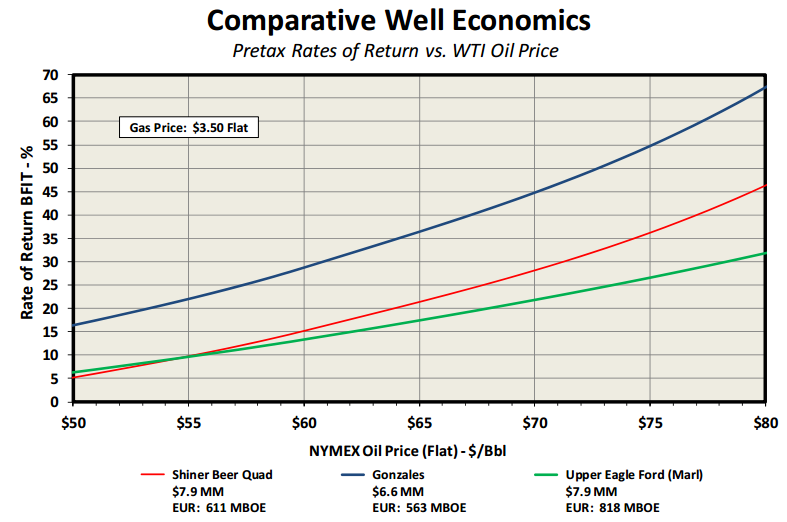
PVA turned in line 11 Upper Eagle Ford wells in the quarter. Average volumes of 23 Upper EF wells brought online in the last 12 months averaged IP rates of 1,223 BOEPD with a average 30-day rate of 942 BOEPD. PVA estimates place recovery at 818 MBOE per well.
The most productive region, in terms of volume, has been its Rock Creek and Lavaca “Beer Area” assets, with both assets returning 30-day rates greater than 1,000 BOEPD. Its Upper EF asset is right behind at 942 BOEPD and is the least oil-intensive of its prospects, with crude accounting for 65% of the percentage.
A total of 33 gross EF wells (18.9 net) were turned in line in Q1’15. The group averaged IP rates of 1,288 BOEPD and 30-day volumes of 813 BOEPD, both averaging 86% oil. The company executed more than 1,400 hydraulic fracturing stages in the quarter at nearly a 100% success rate.
Quarterly Results
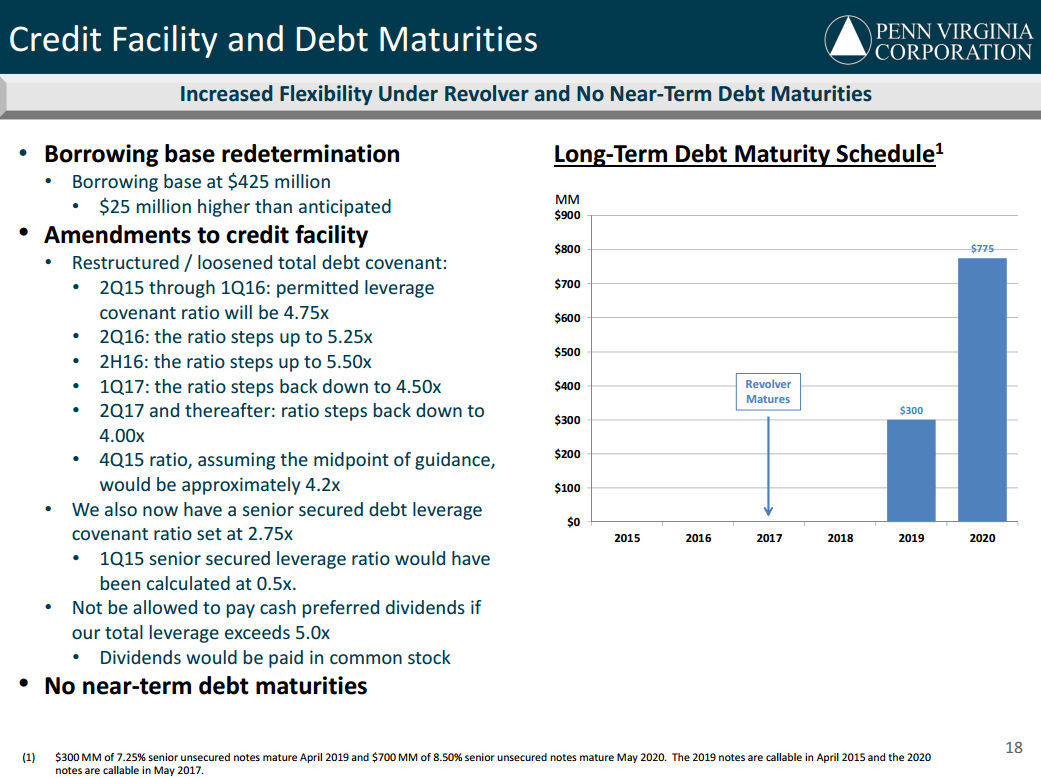
PVA reported a net loss of $63.2 million ($0.88 per share) in the quarter on revenues of $110.6 million. The company’s revolver was redetermined to $425 million – above the originally planned commitment of $400 million. Total liquidity as of March 31, 2015 was $265 million.
PVA’s near-term cash flows are strengthened by attractive hedges that cover about 85% to 90% of its crude production at weighted average floor/swap prices of $90.48/barrel for Q2’15. An estimated 70% to 80% of 2H’15 crude production is hedged at weighted average/floor swap price of $89.86/barrel. The company holds no natural gas hedges.
$147 million was spent in the quarter, but expenditures are planned to taper off the second half of the year. An expected 70% of the $325 to $370 million in capital guidance will be used in the first half of 2015, and full year production is expected to average 23,800 to 26,200 BOEPD – a 15% year-over-year midpoint increase.
The additional cost reductions will amplify returns, Whitehead said. Based on flat prices of $65/barrel and $3.50/MMcf, PVA expects its Upper EF, Beer Area and Gonzales assets to increase IRR’s by three to four percentage points apiece if the company achieves its goal of $400,000 additional cost reductions in 2015.
Important disclosures: The information provided herein is believed to be reliable; however, EnerCom, Inc. makes no representation or warranty as to its completeness or accuracy. EnerCom’s conclusions are based upon information gathered from sources deemed to be reliable. This note is not intended as an offer or solicitation for the purchase or sale of any security or financial instrument of any company mentioned in this note. This note was prepared for general circulation and does not provide investment recommendations specific to individual investors. All readers of the note must make their own investment decisions based upon their specific investment objectives and financial situation utilizing their own financial advisors as they deem necessary. Investors should consider a company’s entire financial and operational structure in making any investment decisions. Past performance of any company discussed in this note should not be taken as an indication or guarantee of future results. EnerCom is a multi-disciplined management consulting services firm that regularly intends to seek business, or currently may be undertaking business, with companies covered on Oil & Gas 360®, and thereby seeks to receive compensation from these companies for its services. In addition, EnerCom, or its principals or employees, may have an economic interest in any of these companies. As a result, readers of EnerCom’s Oil & Gas 360® should be aware that the firm may have a conflict of interest that could affect the objectivity of this note. The company or companies covered in this note did not review the note prior to publication. EnerCom, or its principals or employees, may have an economic interest in any of the companies covered in this report or on Oil & Gas 360®. As a result, readers of EnerCom’s reports or Oil & Gas 360® should be aware that the firm may have a conflict of interest that could affect the objectivity of this report.
