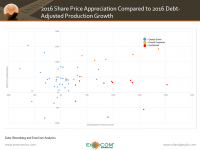
What Does a Growth Company Look Like Following the Downcycle?
Investors valued debt-adjusted growth even more in 2016
The crash in oil prices which started at the end of 2014 exposed a number of oil and gas companies that had sacrificed their balance sheet in the name of growth. Many …