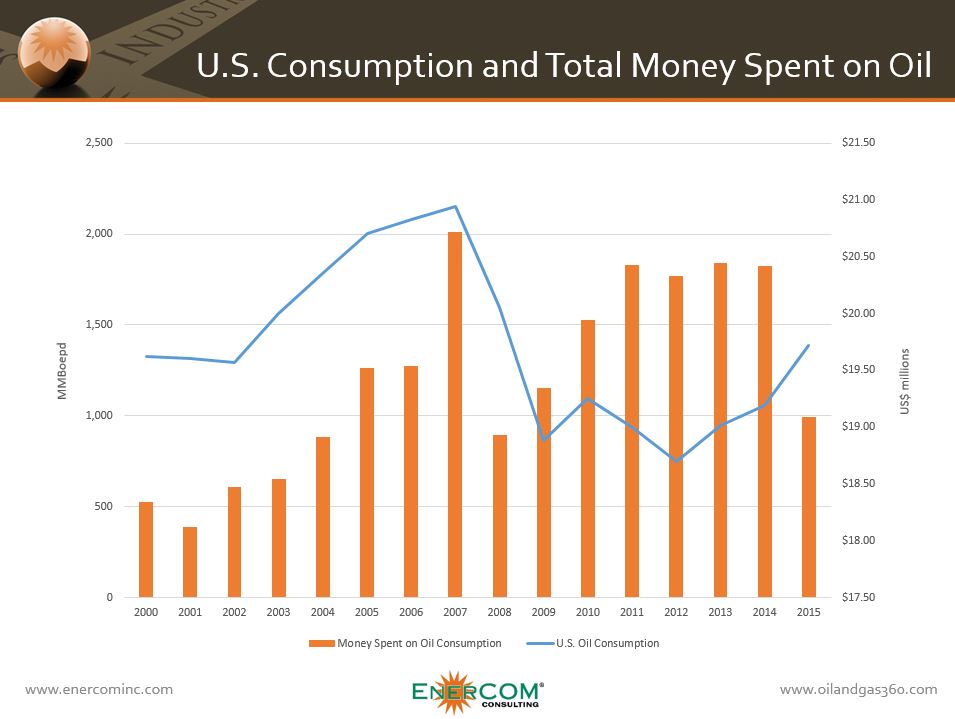
Every day in 2015, the United States spent $991 million on petroleum consumption, the lowest daily total since 2008. Consumption levels in the U.S. have decreased slightly to 19.72 MMBoepd since peaking in 2007 at 20.94 MMBoepd.
To determine spending levels, the overall oil consumption in the U.S. was multiplied by the SEC standard oil price for that year.
The total consumption of petroleum products in the U.S. has been largely stagnant over the course of the last fifteen years, marked by the 20.94 MMBoepd high in 2007, and a low of 18.69 in 2012. This would make sense in the context of a growing population simultaneously realizing increased energy efficiency.
However, there is also another factor to consider. Between 1990 and 2004, the average vehicle miles traveled saw a continual increase at an average of 2.33% per year. In 2004, oil prices began a move upward from an average of $41.47 per barrel in 2004 to $72.44 in 2007, and all the way up to $95.15 per barrel in 2011. The average vehicle miles traveled began to plateau in 2004, changing an average of negative 0.06% between 2005 and 2012 (the most recent year on record with the Department of Transportation).
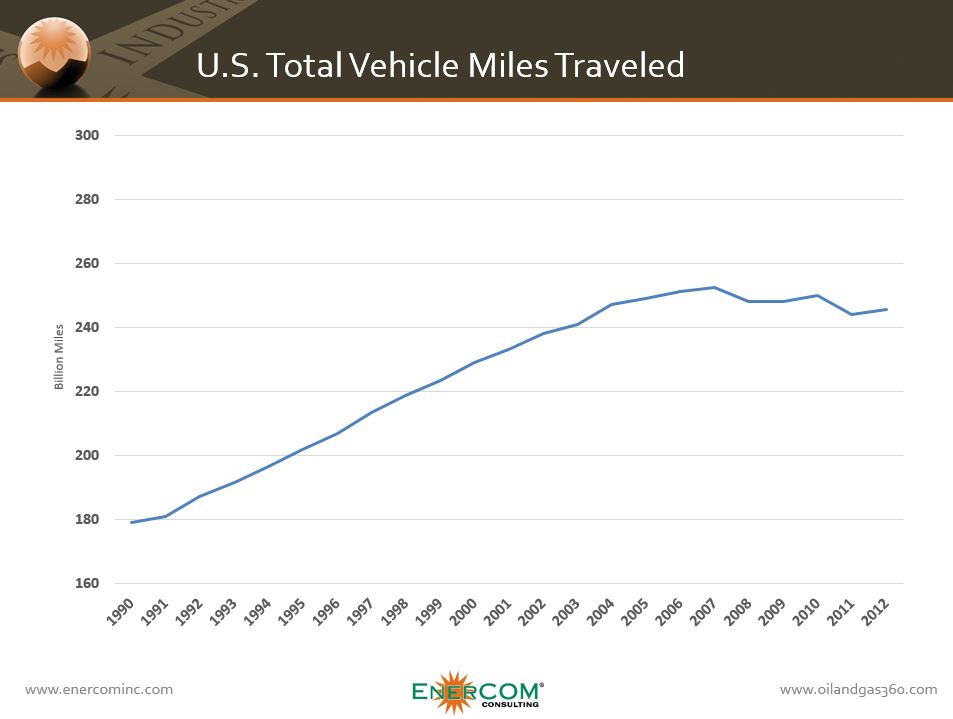
Oil prices certainly have an effect on the overall spending, but the decrease in miles driven can provide more insight into the fluctuations. Oil prices averaged roughly $95 per barrel from 2011 to 2014, but the vehicle miles driven flat-lined.
