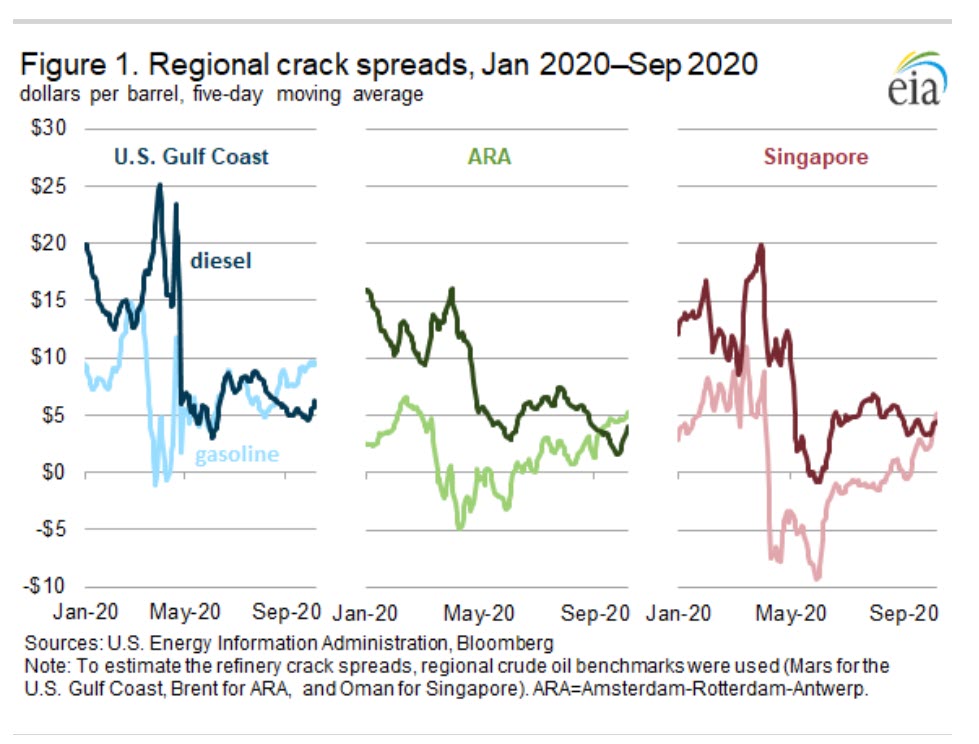
In its latest Short-Term Energy Outlook (STEO), the U.S. Energy Information Administration (EIA) estimates that third-quarter 2020 global liquid fuels consumption averaged 94.2 million barrels per day (b/d), an increase from the second quarter but significantly lower than the same time last year. The slow recovery has contributed to low gasoline and diesel crack spreads and high petroleum product stocks in three major petroleum product trading and refining centers—the U.S. Gulf Coast, the Amsterdam-Rotterdam-Antwerp (ARA) region, and Singapore. Between April and September, the five-day moving average crack spread for each product in all regions, except for U.S. Gulf Coast gasoline, declined to their lowest levels since at least 2011 (Figure 1). September crack spreads remained significantly lower than their previous five-year (2015-19) averages. EIA has reduced its forecast for 2021 global consumption of petroleum and other liquids as a result of lowered expectations for economic growth in both 2020 and 2021, leading to a balanced global inventory outlook in 2021.
Since June, regional gasoline crack spreads have generally increased as global petroleum consumption continues to climb after reaching a recent low in April. Although the gasoline crack spreads are generally increasing, they remain relatively low. Compared with September 2019, U.S. Gulf Coast gasoline crack spreads were $3 per barrel (b) (27%) lower in September 2020, ARA gasoline crack spreads were $2/b (29%) lower, and Singapore crack spreads were $3/b (61%) lower (Figure 2).
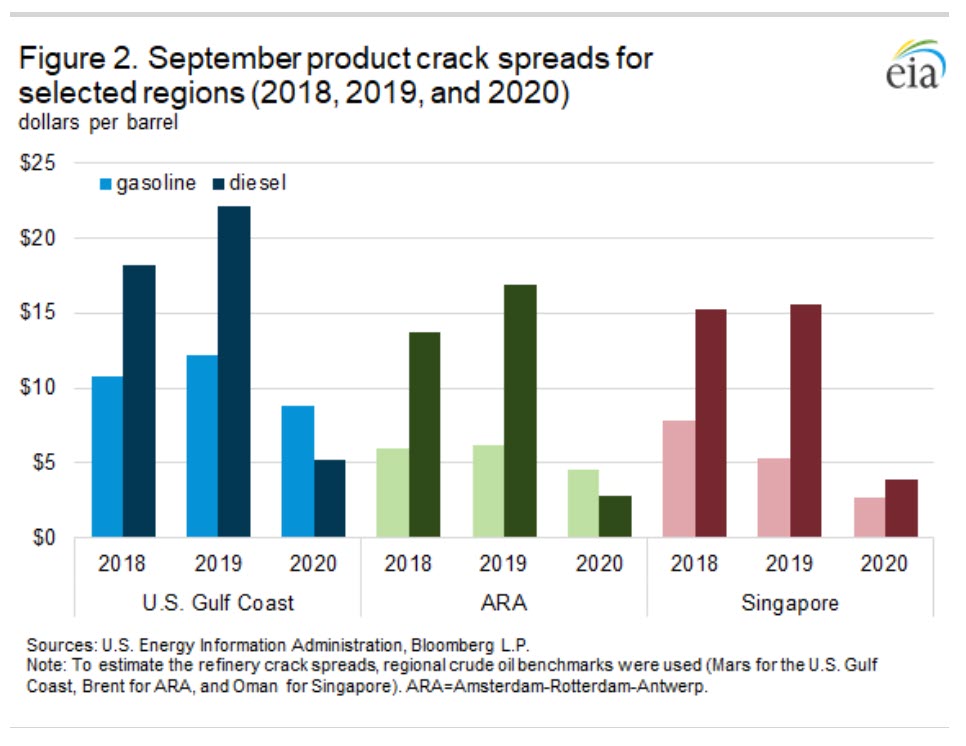
Diesel crack spreads initially rose in March and early April as increased demand from trucking likely contributed to higher diesel consumption. Between May and September, the monthly average regional diesel crack spreads reached their lowest levels since at least 2011. The U.S. Gulf Coast diesel crack spread fell to $5/b in May, the Singapore spread fell to $1/b in May, and the ARA spread fell to $3/b in September. The September 2020 diesel crack spread in the U.S. Gulf Coast was 76% lower than September 2019, the ARA diesel crack spread was 83% lower, and the diesel crack spread in Singapore was 75% lower.
The significant decrease in transportation fuel demand has led to an increase in petroleum product stocks across all major petroleum product trading hubs since the end of the first quarter of 2020. Except for ARA gasoil stocks, petroleum product inventories in each location are higher than their respective five-year average levels (Figure 3). For the week ending August 13, ARA gasoline stocks reached the highest level since at least 2009 and remain almost 50% higher than the previous five-year average.
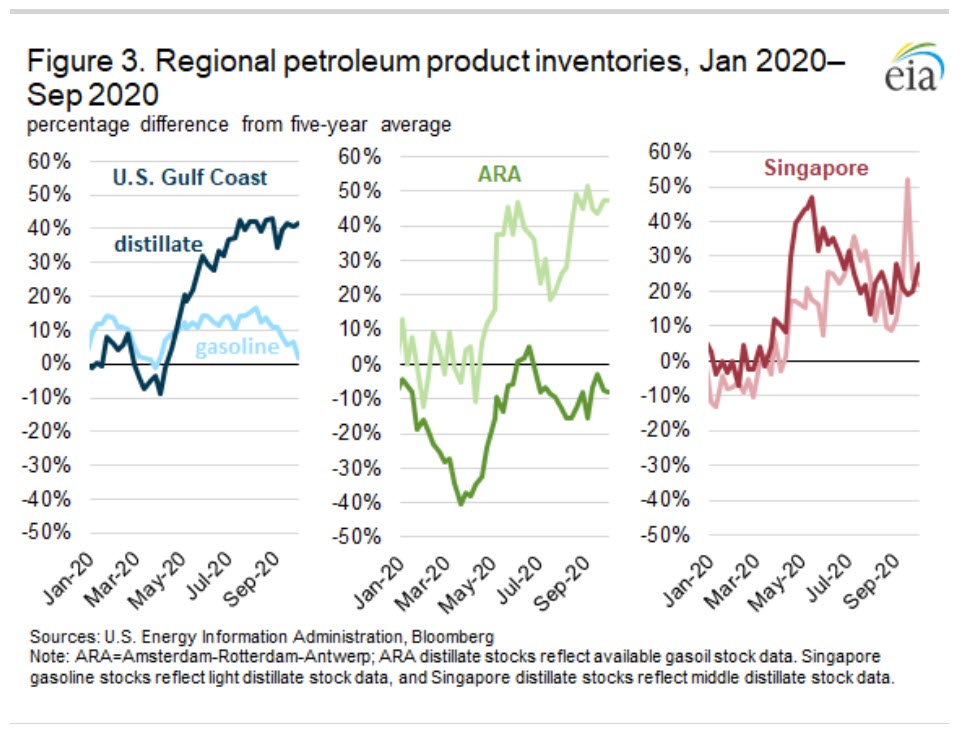
Distillate inventories on the U.S. Gulf Coast reached a record high the week of August 21, 43% higher than the previous five-year average, and remained near this level through September. U.S. Gulf Coast gasoline inventories were 16% higher than the previous five-year average the week of August 7. Since then, they have fallen to 2% higher than the previous five-year average for the week of October 2.
Singapore middle distillate stocks (which includes gasoil and kerosene) reached 16.0 million barrels the week of September 2, 2020, the highest level since 2011. The week of September 16, Singapore light distillate stocks (which includes gasoline, reformate, and naphtha) reached 17.5 million barrels, the highest level since at least 1995. For the week ending September 30, Singapore middle distillate and light distillate stocks were 28% and 22% higher, respectively, than their previous five-year averages.
These low crack spreads and high petroleum product inventories reflect the slow recovery in global oil demand in the third quarter. In India and the United States (which both provide timely petroleum consumption data), initial data indicate petroleum consumption was lower than expected. In India, a combination of flooding and responses to increased COVID-19 cases led to August petroleum consumption (the latest data available and released after publication of the September STEO) of 4.0 million b/d. This consumption level is 0.3 million b/d (8%) lower than EIA’s forecast of 4.3 million b/d in the September STEO. Furthermore, EIA lowered India’s gross domestic product (GDP) forecast from -5.8% in 2020 in the September STEO to -10.2% in the October STEO, based on forecasts from Oxford Economics. The lower actual consumption combined with lowered economic growth expectations led EIA to lower its forecast for India’s 2020 and 2021 consumption by 60,000 b/d and 160,000 b/d, respectively, in the October STEO.
In the October STEO, EIA increased its U.S. GDP growth rate for 2020 and 2021 based on macroeconomic forecasts by IHS Markit. Weekly data indicate, however, that consumption of petroleum products in September was lower than expected in last month’s STEO. Because of the lower-than-expected consumption data, in the October STEO, EIA revised its U.S. petroleum consumption forecast down by 1.0% in 2020 and 0.5% in 2021. As a result of these revisions, the annual U.S. consumption growth rate in 2020 fell to -11.3% in the October STEO, but the 2021 growth rate increased to 9.6%.
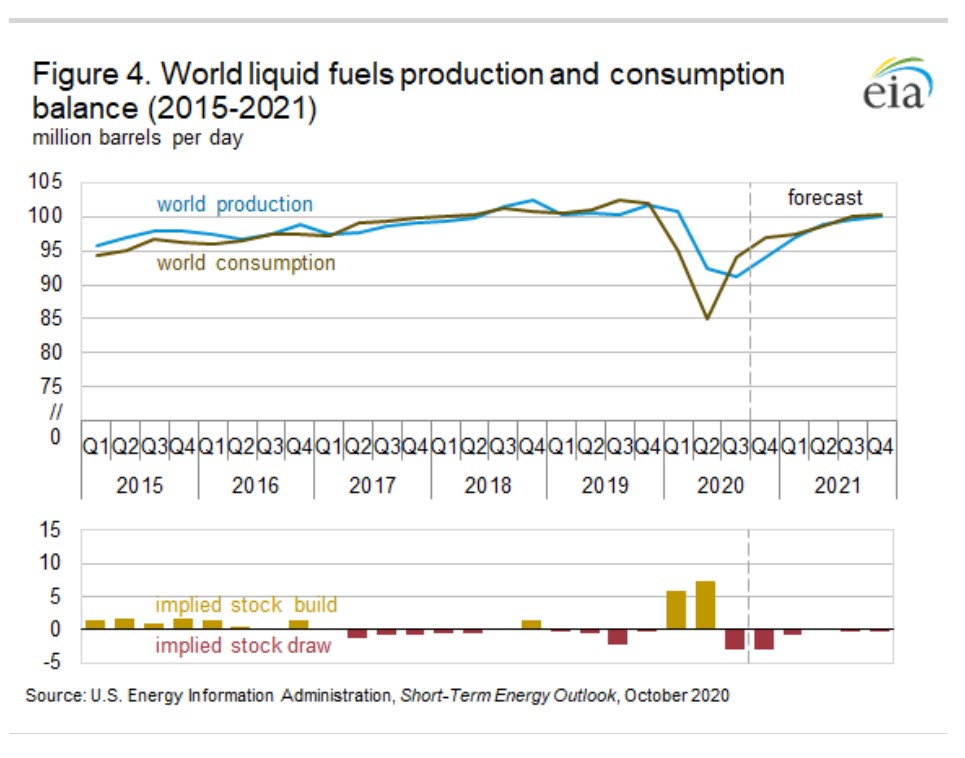
EIA revised down global GDP in the October STEO in both 2020 and 2021, based on macroeconomic forecasts by Oxford Economics. The slower demand recovery combined with revised forecasts for global economic growth led EIA to lower the 2021 global oil consumption forecast (Figure 4). In the October STEO, EIA forecasts 2021 global oil consumption will be 99.1 million b/d, down 0.5 million b/d from the September STEO forecast. The slower demand recovery will likely limit draws in global petroleum inventories, which could keep petroleum product stocks in the United States, ARA, and Singapore regions elevated and maintain downward pressure on global crack spreads.
U.S. average regular gasoline price increases, diesel price decreases
The U.S. average regular gasoline retail price increased less than 1 cent, remaining virtually unchanged at $2.17 per gallon on October 5, 47 cents lower than the same time last year. The East Coast price increased more than 2 cents to $2.13 per gallon. The Rocky Mountain price decreased more than 2 cents to $2.27 per gallon, the West Coast and Midwest prices each decreased 1 cent to $2.81 per gallon and $2.05 per gallon, respectively, and the Gulf Coast price decreased nearly 1 cent to $1.83 per gallon.
The U.S. average diesel fuel price decreased nearly 1 cent, remaining virtually unchanged at $2.39 per gallon on October 5, 66 cents lower than a year ago. The Rocky Mountain price decreased nearly 2 cents to $2.32 per gallon, the Gulf Coast price decreased more than 1 cent to $2.14 per gallon, and the Midwest price decreased 1 cent to $2.26 per gallon. The West Coast and East Coast prices were unchanged at $2.93 per gallon and $2.47 per gallon, respectively.
Propane/propylene inventories decline
U.S. propane/propylene stocks decreased by 0.1 million barrels last week to 101.8 million barrels as of October 2, 2020, 12.3 million barrels (13.8%) greater than the five-year (2015-19) average inventory levels for this same time of year. Midwest inventories decreased by 0.8 million barrels. East Coast inventories increased by 0.3 million barrels, and Gulf Coast and Rocky Mountain/West Coast inventories each increased by 0.2 million barrels.
Residential heating fuel price survey begins this week
Beginning this week and continuing through the end of March 2021, prices for residential and wholesale heating oil and propane will be included in This Week in Petroleum and on EIA’s Heating Oil and Propane Update webpage.
As of October 5, 2020, residential heating oil prices averaged almost $2.12 per gallon, nearly 84 cents per gallon lower than at the same time last year. The average wholesale heating oil price for the start of the season averaged almost $1.20 per gallon, more than 79 cents per gallon below last year’s price.
Residential propane prices entered the 2020–21 heating season at an average of more than $1.76 per gallon, almost 8 cents per gallon less than at the same time last year. Wholesale propane prices averaged nearly $0.65 per gallon, more than 6 cents per gallon higher than a year ago.
