Macquarie Securities’ Toronto-based research team put out a research note today that pointed out the strength coming out of the world’s spending giant: the U.S. consumer. “Macro data continues to show that the global economy’s $13 trillion gorilla—the US consumer—is getting even stronger,” the firm said.
Pointing to an Atlanta Fed estimate, Macquarie said real consumer spending is tracking at a 4.5% pace for the current quarter, marking its strongest quarterly growth rate in over a decade.
Macquarie takes a contrary position to its peers: “While some commentators have compared the consumer’s performance in the current expansion to the 1930s, we find that this couldn’t be further from the truth. While from 1929 to 1938 nominal spending fell by ~17%, from 2007 to 2016 it has risen by ~30%.”
U.S. spending gains in 2016 are underpinned by sound fundamentals, “suggesting further gains lie ahead,” Macquarie reported.

The Fundamentals that are Driving U.S. Consumer Spending Growth – source Macquarie Securities
Macquarie’s analysts said that over the past 18 months two areas in the U.S. economy were singlehandedly responsible for nearly all of the gains in U.S. consumer spending: services and ecommerce.

Source: Macquarie Securities
Macquarie included a chart that tracks the percentage of personal consumption expenditures for goods and services. In it they say that in 1947 American consumers put about 38% of personal consumption dollars toward services and about 62% towards the purchase of goods. Now, 70 years later, the ratio has flipped. U.S. consumers direct 68% of their personal consumption dollars into services and only 32% into goods.
Does that mean we’re spending our time driving around to restaurants and movies, or are we sitting around at home ordering everything we can find on Amazon, after which UPS puts its 500 jets and 5,600 vehicles in motion to bring recent purchases to your household’s front porch? With quarterly online retail sales approaching $100 billion, more than double department store sales, it seems that way.
Energy
So what does this bullish view of U.S. consumer spending say about energy demand?
“[The] consumer is as resilient as ever to increases in the gasoline price and interest rates,” Macquarie says. “The share of disposable income spent on each of these is at multi-decade lows.” The current near-zero interest rates along with today’s cheap energy prices account for that. With oil tracking along at about $45 per barrel (WTI), down from the $95 WTI of 2011, 2012 and 2013, making gasoline in the U.S. available to consumers at prices between $2.00 and $2.50 per gallon.
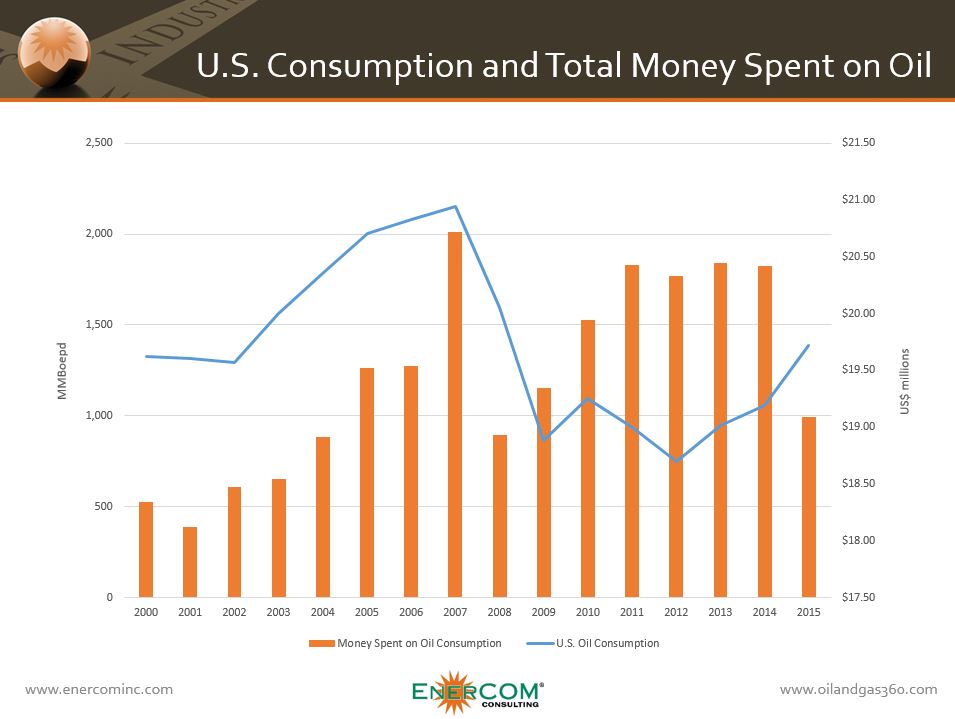
The U.S. spent $991 million per day on petroleum products in 2015, the lowest daily total since 2008. At the same time, consumption levels in the U.S. have decreased only slightly to 19.72 MMBoepd since peaking in 2007 at 20.94 MMBoepd.
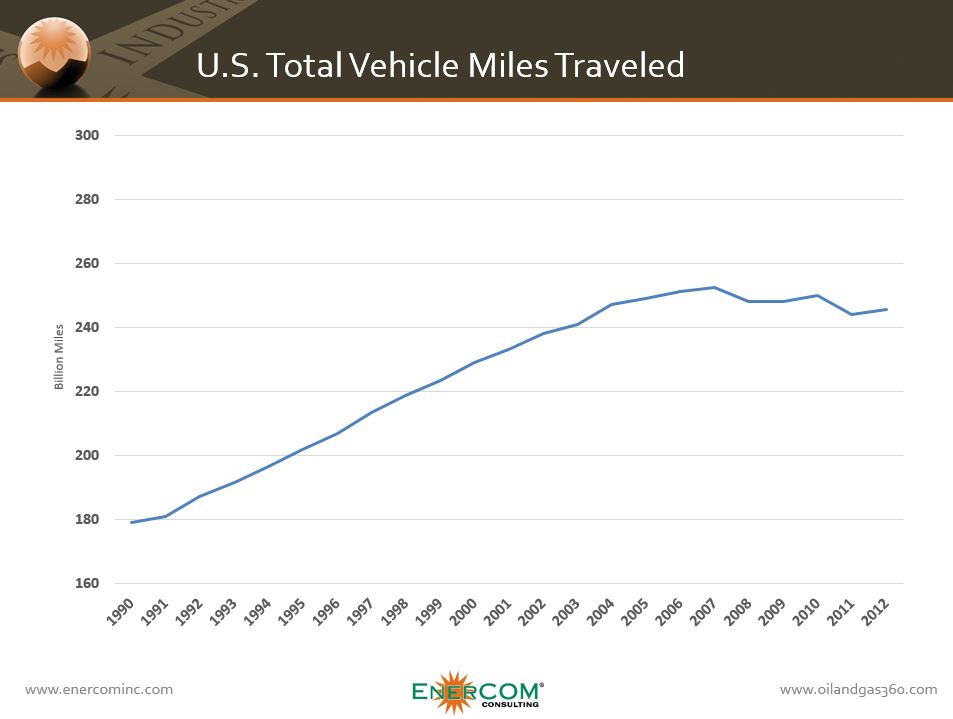
Oil & Gas 360®’s chart of the week story points out that oil prices have an effect on the overall spending, but the decrease in miles driven can provide more insight into the fluctuations. Oil prices averaged roughly $95 per barrel from 2011 to 2014, but the vehicle miles driven flat-lined.
Today’s American Auto Industry is Delivering to Consumers 62% Better Fuel Efficiency
In a story this week, Barron’s pointed to overall energy efficiency achievements flattening the sales volumes of electric utilities in the U.S. “You can blame economic efficiency. Americans have learned to do more with less, and U.S. industry has switched from making electricity-guzzling basic products to products with more value added.” Barron’s said that if Americans converted to LED lighting, that would reduce sales of electricity by another 10%.
Automobiles have come a long way since the gas guzzling ‘70s. A huge increase in fuel efficiency is another factor that is responsible for leaving more cash available to consumers.
U.S. car manufacturers have achieved a whopping 62% fuel efficiency improvement with today’s new light duty vehicles. According to the U.S. DOT’s Bureau of Transportation Statistics, the average fuel efficiency of new domestic light duty passenger cars has come all the way from 22.6 miles per gallon in 1980 to 36.7 MPG in 2014.
In 2015, about 140.43 billion gallons of gasoline were consumed in the United States, a daily average of about 384.74 million gallons per day. According to EIA data, this was about 1.5% less than the record high of about 390 million gallons per day (or about 9.29 million barrels per day) consumed in 2007.
The American Automobile Association said that nearly 43 million Americans would travel (36 million by highway vehicles) on the recent Independence Day weekend. This represents the highest fourth of July travel volume on record and five million more travelers compared to Memorial Day weekend, the AAA said.
U.S. Drivers have Saved about $20 Billion on Gasoline so far this Year: AAA
The AAA calculated that U.S. drivers have saved about $20 billion on gasoline so far this year compared to the same period in 2015. Eighty-four percent of holiday travelers – more than 36 million people drove to holiday destinations, an increase of 1.2 percent over last year.
Motor gasoline consumption is forecast by the EIA to increase by 130,000 b/d (1.5%) to 9.29 million b/d in 2016, which would make it the highest annual average gasoline consumption on record, beating the previous record set in 2007 by 0.1%. The increase in gasoline consumption reflects a forecast 2.5% increase in highway travel (because of employment growth and lower retail gasoline prices) that is partially offset by increases in vehicle fleet fuel economy. EIA forecasts that gasoline consumption in 2017 will be close to the 2016 average.

Source: EIA
