The equity markets endured a good old-fashioned stomp-down last week, behaving in almost panic mode. Uncertainty over the Fed, uncertainty over the ECB, slowing economies in China and Europe, Ebola fears and the diving price of oil were among things that triggered heavy selling in last week’s equities markets, according to TV’s talking heads.
“The markets finally woke up to the fact that the U.S. lives in a global world,” one said. “Hedge funds sold everything that wasn’t nailed down,” said another. The financial experts talked about Citi labeling free-falling oil prices a “$1.1 trillion dollar stimulus to the U.S. economy.” “It’s a flight to safety”; “To QE or not to QE?”; “It’s an overseas problem coming from Europe.” “It’s a devastating, tear jerking, rollercoaster,” one TV host summarized Wednesday’s stock market bludgeoning.
But in the aftermath of Wednesday’s selloff, Thursday dawned and the dark clouds burned off after a while, and by Friday people were starting to talk about the weekend’s coming football games. Saturday brought financial news from the UK that was at best confusing. You could go with either of these stories that arrived together in the same email alert: “Keep interest rates low, says Bank” – from BBC News, or “Interest rates need to rise, says Bank of England rebel Martin Weale” – from The Telegraph. By Monday morning Bloomberg seemed to have things figured out: “Leveraged Money Spurred Stock Market Selloff; ‘Liquidity Isn’t What It Used to Be’.”
Meanwhile back at the oil patch, development and production activities continued because people still want to drive their kids to school and soccer, they still need to ride to work, they still need trucks and trains to keep shelves stocked.
 So what does the future hold for the people in the business of extracting the crude oil that allows the U.S. economy to keep moving?
In a note to investors last Wednesday, UBS said, “E&P capex could decline 5-10% in 2015 in a sub-$80/Bbl WTI scenario.”
“With oil prices down ~24% since mid-June on a combination of weaker than expected demand and robust supply growth, recent reports that Saudi Arabia will tolerate oil below $80/Bbl (effectively shifting its focus from defending price to maintaining market share) have prompted investors to shift focus to what oil price would be required to reduce US oil production growth. With consensus 2015 capex for E&Ps up ~5% YoY (UBSe +2% YoY), we believe spending would be at risk of declining 5-11% YoY next year if WTI averages $80/Bbl, based on historical capex plowback ratios.
However, should prices sustain below the $80/Bbl level, we believe E&P managements will begin implementing spending reductions in 2015 in order to preserve financial flexibility, which would serve to curtail production growth and start the process of self-correcting oil prices.”
Other energy research groups expressed similar sentiment. Wells Fargo called for non-core, high-cost regions to take a cap-ex hit next year, while the high-margin North American shale plays maintain course. This view was mirrored by a number of other analysts.
Not the First Time at this Rodeo
U.S. oil and gas companies have been through volatile commodity prices a few times before. On October 22, 2008, EnerCom published a report entitled “$50 Per Barrel Oil & $5.00 Per MMBtu Natural Gas.” The opening bullet point in the executive summary sounds like it could have been written last week: “Commodity prices are extremely volatile, reflecting tremendous uncertainty concerning the extent of what is increasingly looking and feeling like a recessionary period.”
Then: “On July 11, 2008, the price for West Texas Intermediate crude oil (WTI) hit an all-time high of $144.96 per barrel and some prognosticators were forecasting that oil prices could climb as high as $200 per barrel, based on what then looked like strong global demand.”
By Dec. 26 of that same year, WTI crude was selling at $37.58 per barrel.

A New Wild Card for E&Ps: Shale Economics, Drilling/Completion Efficiencies
In the 2014 commodity environment, the U.S. E&P companies have a wild card tucked away. The “factory economics” of shale basin oil and gas production (pad drilling, multi-stage fracs, extended laterals), combined with a relentless drive on the part of operators to increase their efficiencies in drilling, completion and development costs are paying off. Costs are down and EURs are up for many operators in the key U.S. shale basins.
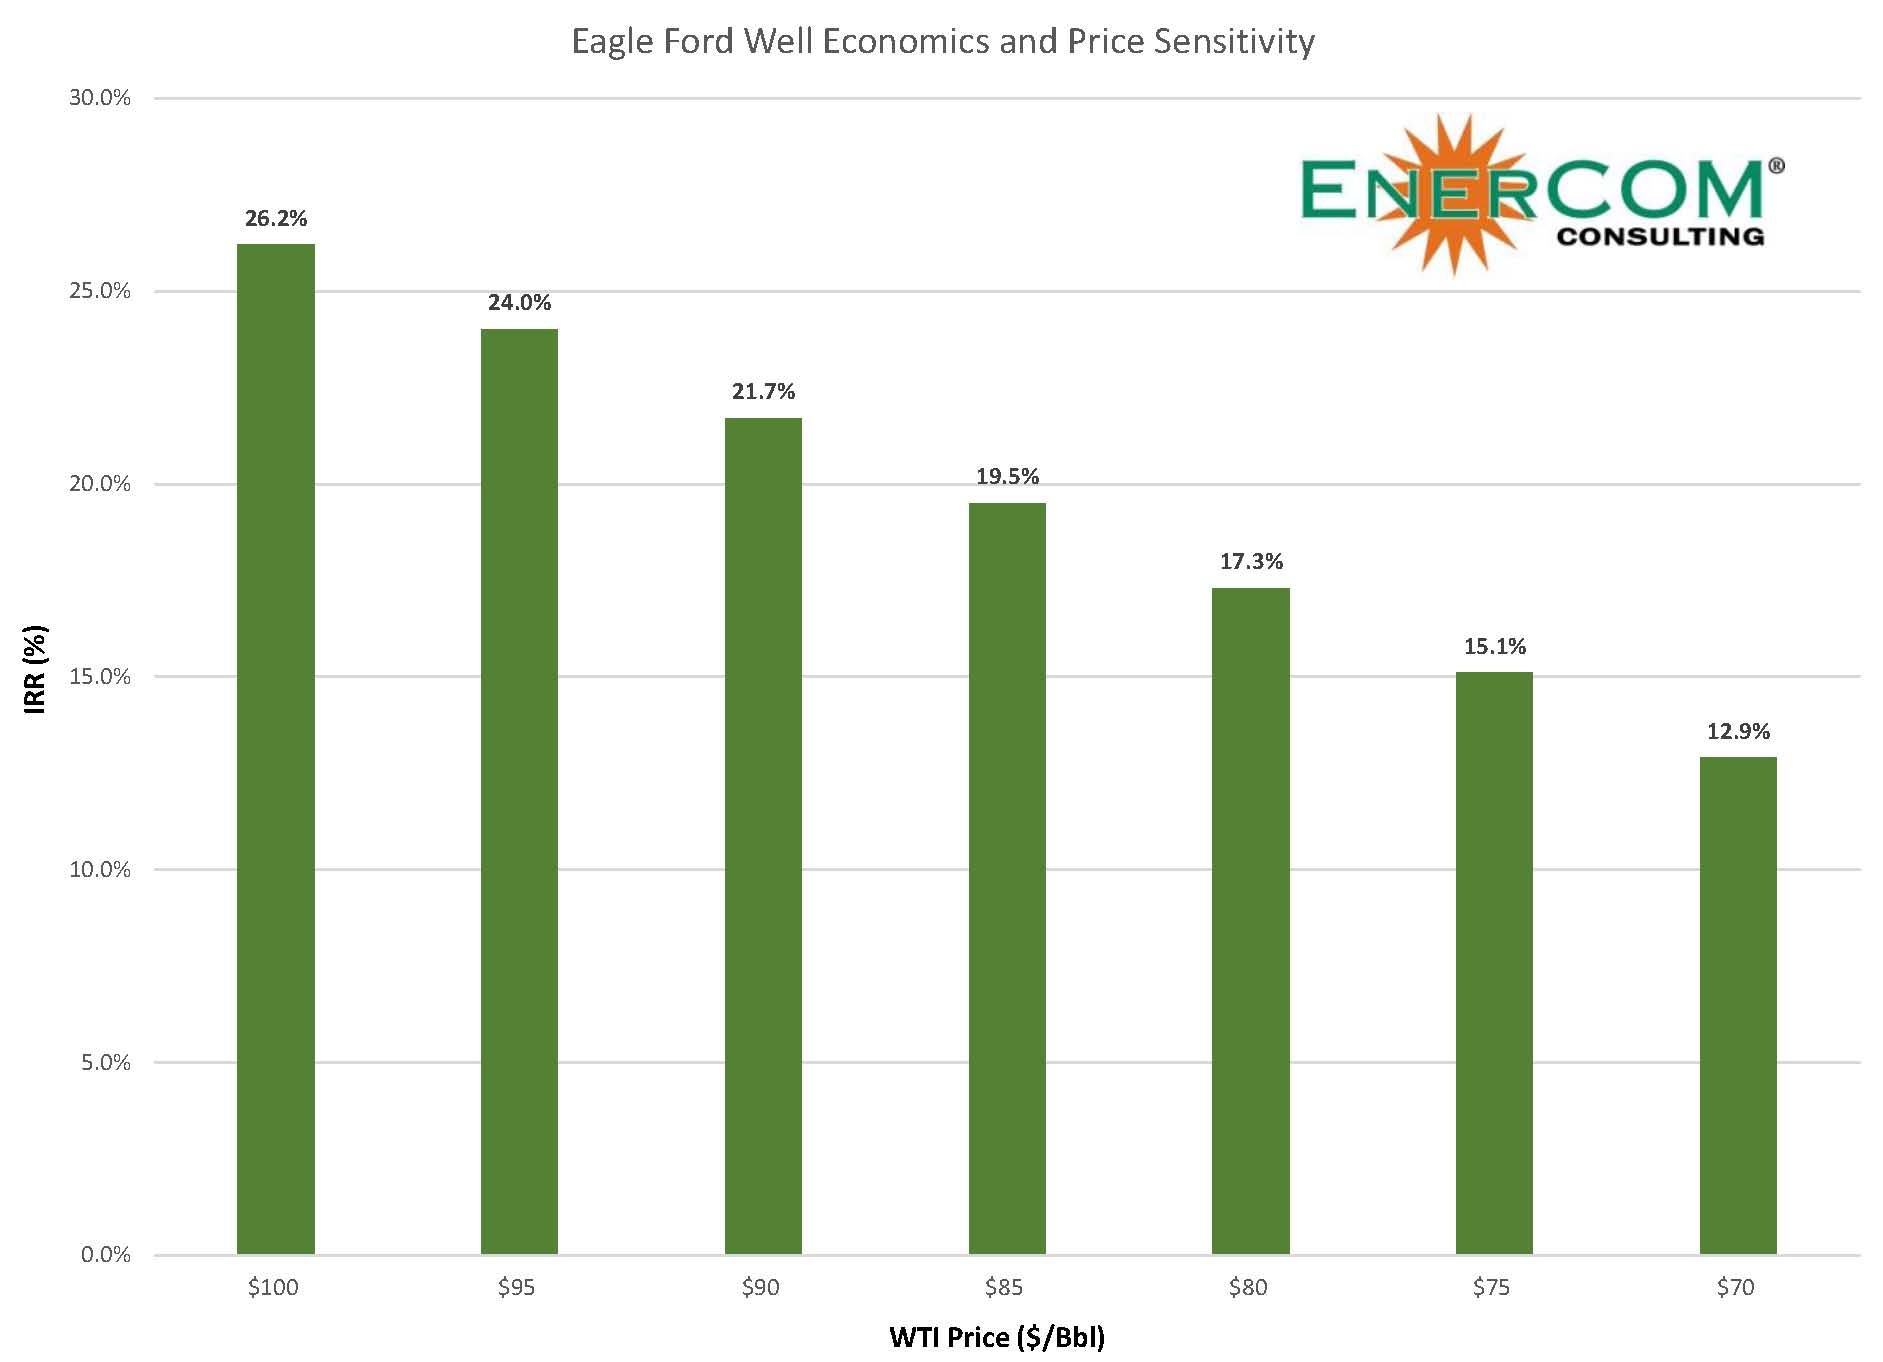 EnerCom’s analysts looked at its crude oil well economics price model to get an idea of margins generated by various crude oil price levels for operators in the Bakken and Eagle Ford.
In its Energy Industry Data and Trends for October 2014, EnerCom analyzed the effect of growing efficiencies generated by the key oil basins, including the number of days from spud to release. “The increase in drilling efficiency since Q1 2012 implies a 17% decrease in drilling costs per well,” the report found.
Notable findings include:
- Between Q1’12 and Q3’14 drilling days in the Williston Basin, primarily related to drilling Bakken and Three Forks wells, declined 33% to 24 days on average from 37 days.
- Between Q1’12 and Q3’14 drilling days in the Eagle Ford shale trend also declined 33% to only 16 days down from 24 days.
“Efficiency improvements mean the same number of rigs can drill more wells, implyingthat compared to Q1’12, the rig fleet is effectively larger. In Q3’14 there were 886 rigs working in the three oil plays in our analysis [Bakken, Eagle Ford, Permian], which compared to Q1’12 was effectively 1,103 rigs. That has helped the industry increase oil production without E&Ps having to contract more rigs, and without drilling contractors having to increase the size of their rig fleets by the same proportion.
“The increase in drilling efficiencies led us to think about rig count in a different way,” the EnerCom report concluded. “If the same fleet could drill more wells, then the notion of an “effective” rig count comes into play. For example, we used Q2’12 as the baseline quarter to compare drilling efficiencies.”

The Payoff: Lower Well Costs, Ability to Work with Lower Margins, Continued Drilling and Development
Reduced drilling days results in a slew of benefits for E&P operators, including reducing drilling costs, increasing returns, improving well economics and encouraging more drilling.
[sam_ad id=”32″ codes=”true”]
Important disclosures: The information provided herein is believed to be reliable; however, EnerCom, Inc. makes no representation or warranty as to its completeness or accuracy. EnerCom’s conclusions are based upon information gathered from sources deemed to be reliable. This note is not intended as an offer or solicitation for the purchase or sale of any security or financial instrument of any company mentioned in this note. This note was prepared for general circulation and does not provide investment recommendations specific to individual investors. All readers of the note must make their own investment decisions based upon their specific investment objectives and financial situation utilizing their own financial advisors as they deem necessary. Investors should consider a company’s entire financial and operational structure in making any investment decisions. Past performance of any company discussed in this note should not be taken as an indication or guarantee of future results. EnerCom is a multi-disciplined management consulting services firm that regularly intends to seek business, or currently may be undertaking business, with companies covered on Oil & Gas 360®, and thereby seeks to receive compensation from these companies for its services. In addition, EnerCom, or its principals or employees, may have an economic interest in any of these companies. As a result, readers of EnerCom’s Oil & Gas 360® should be aware that the firm may have a conflict of interest that could affect the objectivity of this note. The company or companies covered in this note did not review the note prior to publication. EnerCom, or its principals or employees, may have an economic interest in any of the companies covered in this report or on Oil & Gas 360®. As a result, readers of EnerCom’s reports or Oil & Gas 360® should be aware that the firm may have a conflict of interest that could affect the objectivity of this report.
