Come writers and critics
Who prophesize with your pen
And keep your eyes wide
The chance won’t come again.
Nobel Prize winner Bob Dylan must have been an oilman in his youth. How could he have been so prescient to know about OPEC’s November 27, 2014 decision back in 1964? Just in case you’re unfamiliar with the ditty, here’s the video of Dylan performing the song.
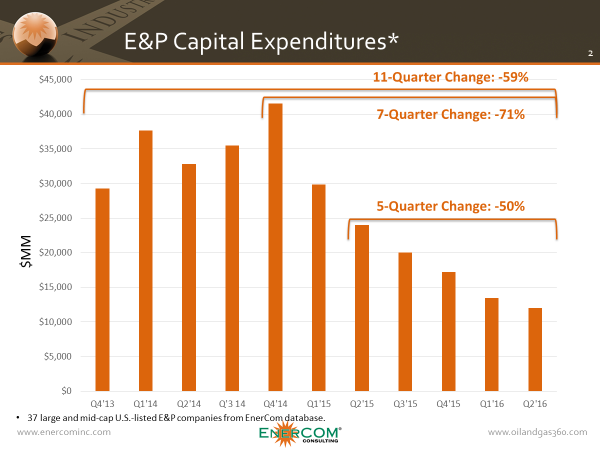
Spending by the EP operator dropped 71% between Q4’14 and Q2’16. We’re looking at the change in light of some thinking that commodity prices have bottomed. Back in June, Bob Dudley, head man for BP PLC, told Bloomberg that the company was a very disciplined operator when it comes to spending. “BP Plc can keep spending at a reduced rate of about $17 billion for another three years without affecting growth,” Dudley said.
On the OilService side, spending between Q4’14 and Q2’16 fell faster than a dropped NFL pass across the middle to the slot back when he gets hammered by the strong safety. That seven-quarter spending reduction was 65%.
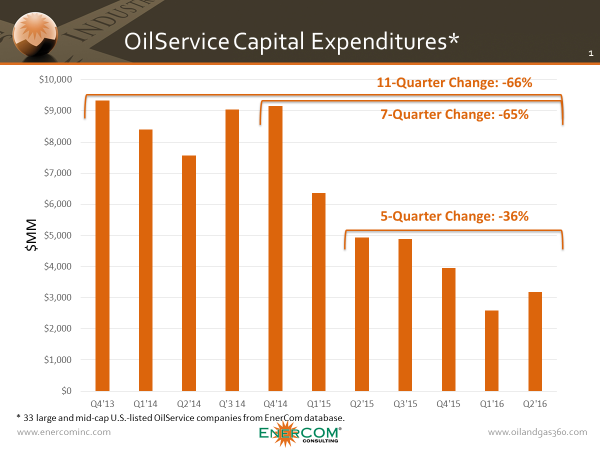
What does the future hold for capital investment by the 70 companies in the above graphs? Executives will tell you that their spending has been right-sized for the times. But the times may be here for a long time. Saudi Arabia launched a $17.5 billion bond offering in the U.S. You launch a bond when your cash cow is being sucked dry. More than 70% of the Kingdom’s cash flows come from oil production. Social programs have been slashed and there is no real industry other than oil and gas to augment Saudi’s treasury. The effects of lower oil prices and greater global economic uncertainty are spreading to major consumption, investment, and government planning decisions that factor in long‐term oil price forecasts. Reduced investment in capital‐intensive projects such factories and infrastructure that boost wages, employment, and spending fuels the global slowdown, further increasing the appeal of U.S. investments and the dollar. Oil & Gas 360® recently reported that Saudi Arabia is looking to cut more than $20 billion of transportation, housing, and healthcare projects due to lower oil export revenues.
OPEC’s producer‐friendly price strategy supports the Saudi Arabia’s long‐term strategy of being a partner to world economic powers by ensuring a steady flow of inexpensive oil. Since 2010, Saudi Arabia controls the majority of OPEC production and enjoys a great degree of flexibility in its productive decisions due to the large amount of spare capacity it maintains. The country’s oil industry is designed to act as a swing producer, with advanced production, refining, and transportation management systems able to quickly control output remotely. At the same time, the country is highly dependent on oil exports to fund its famous cradle‐to‐grave social contract and is currently burning through its foreign reserve holdings at an alarming rate while running an $87 billion budget deficit, 16% of GDP. As of August 2016, the country’s foreign reserves have decreased 16% y‐o‐y.
Back in America, Rex Tillerson has a polar opposite view on supply. We’ve discussed how the North American operator is using technology to fight its way through the recent price cycle. The cost and EURs associated with key plays and acreage are different today than they were in 2014. Tillerson said: “I don’t necessarily have the view that we are setting ourselves up for some big collapse in supply within the next three, four, five years” when he spoke to executives and officials in London.
Efficiencies by the Numbers – Bakken
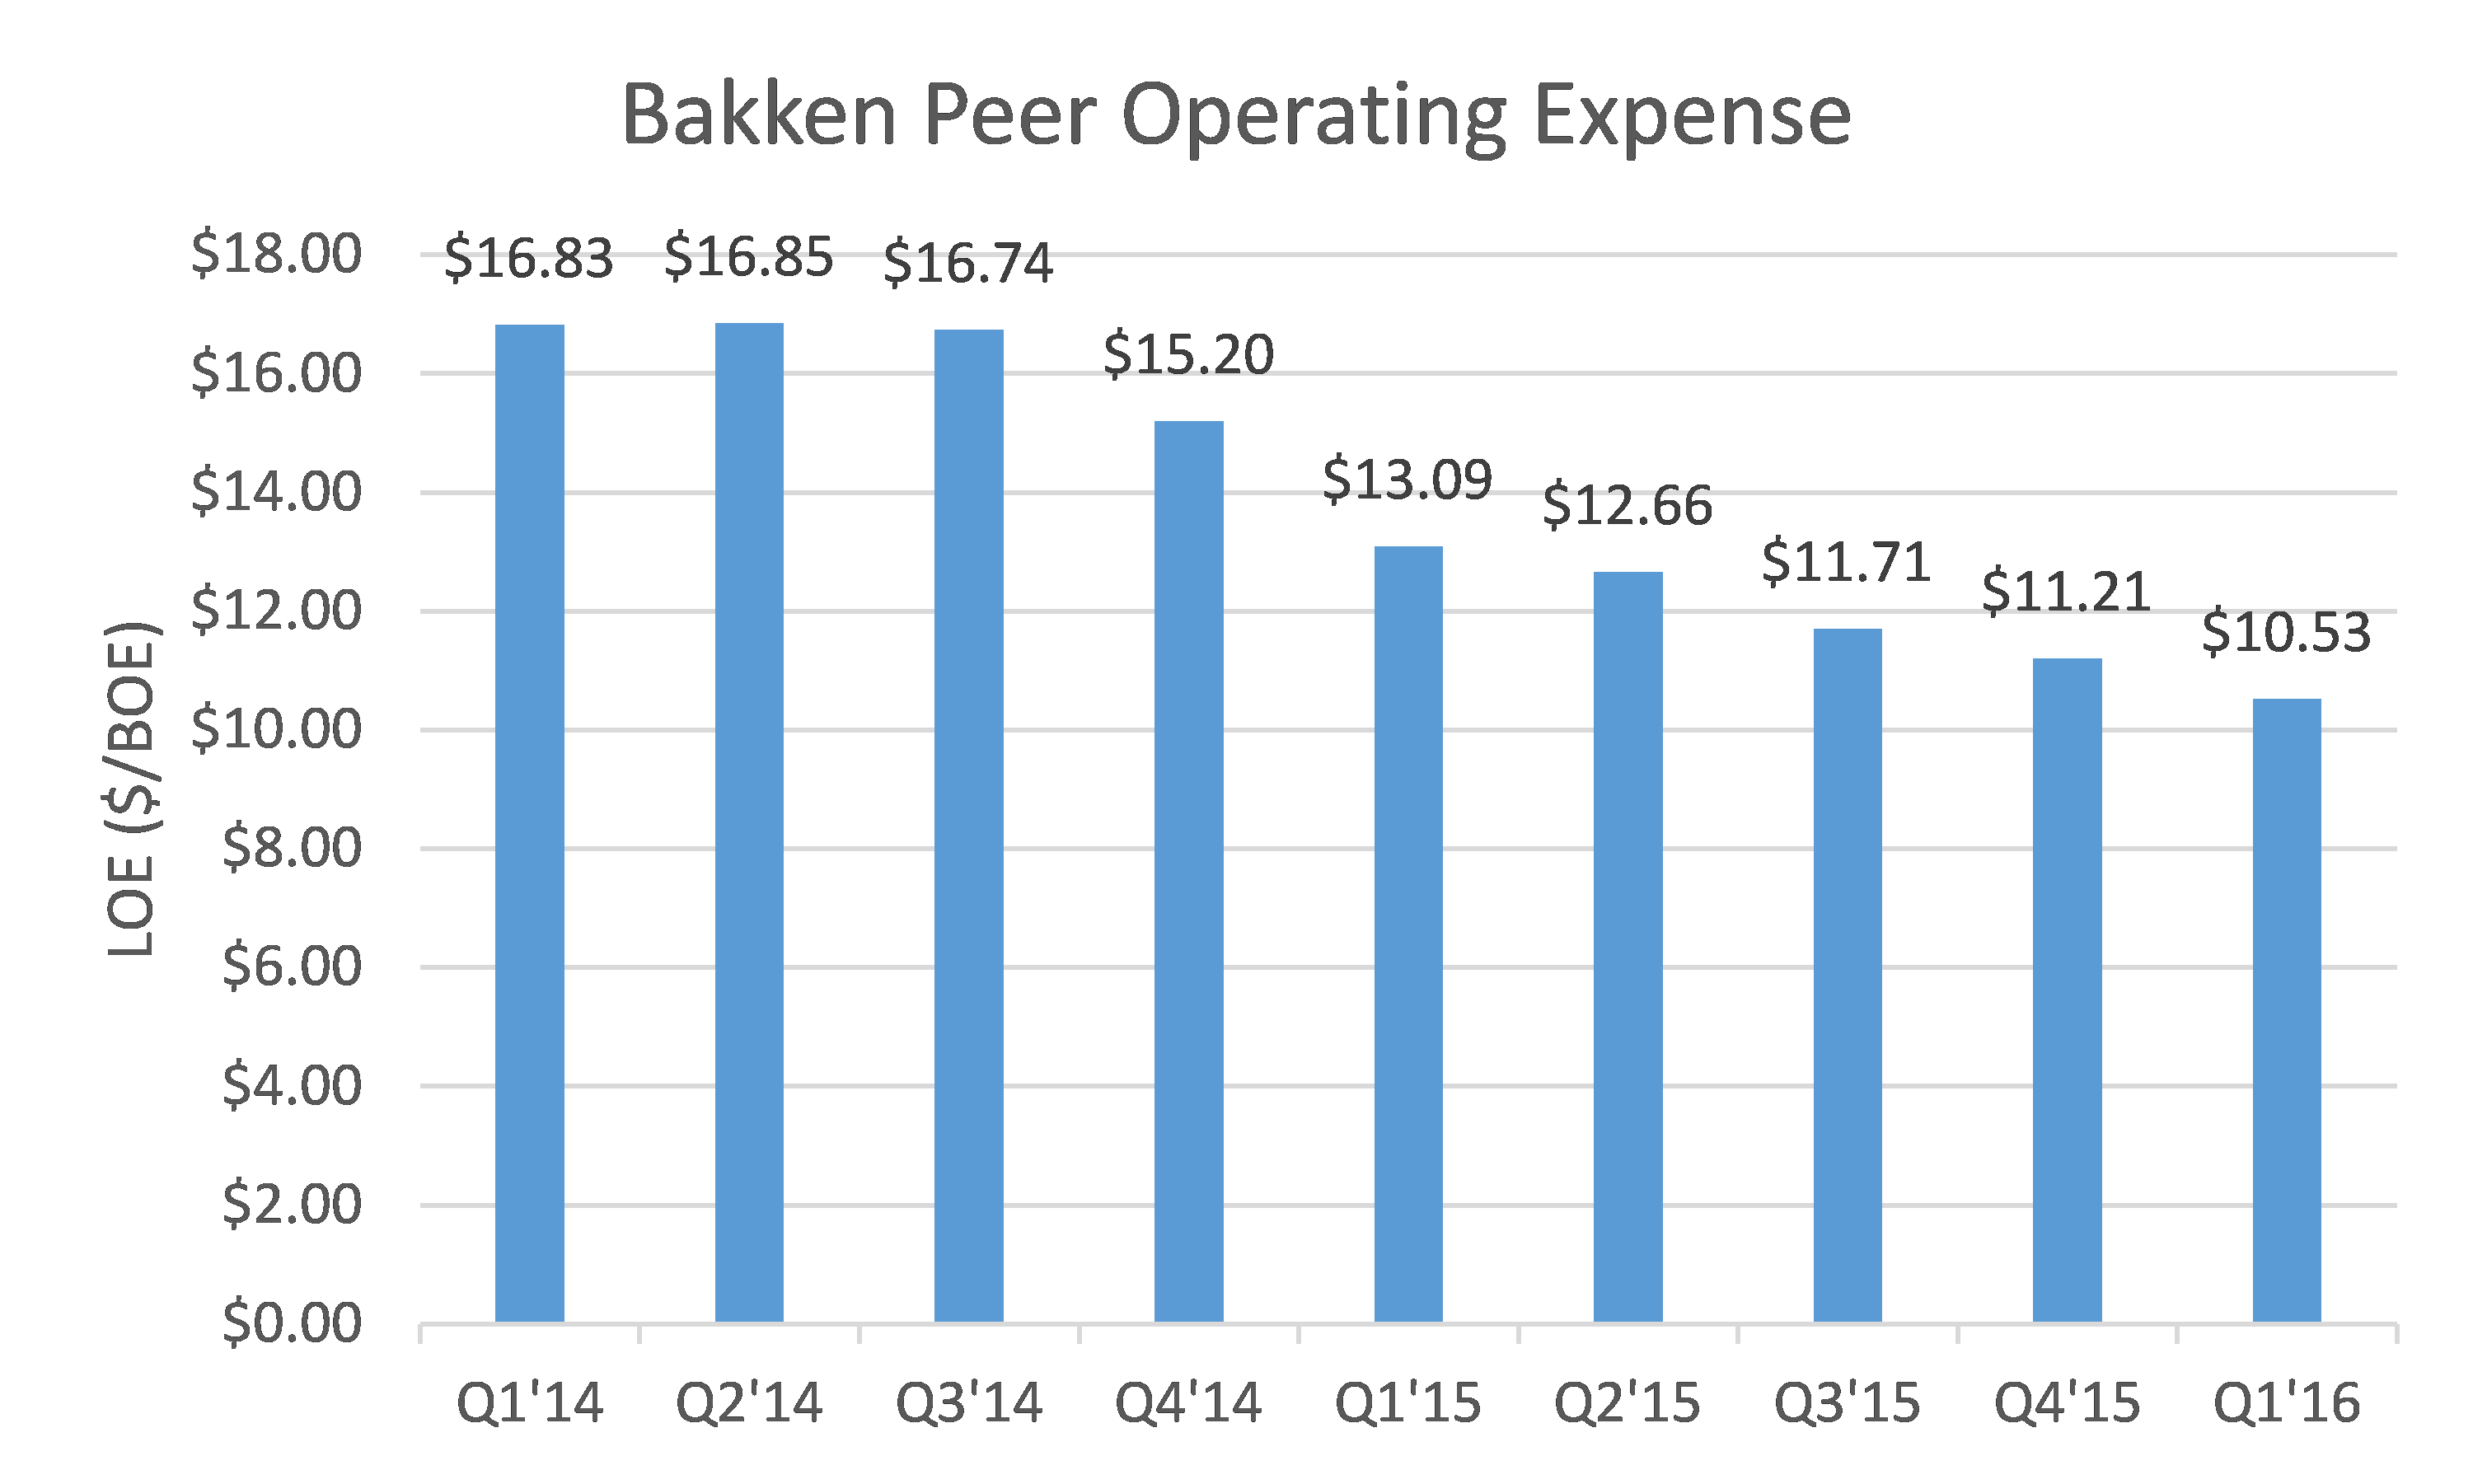
Supporting Tillerson’s point, EnerCom, using its database, analyzed lease operating expense (LOE) data by quarter for Bakken focused companies (CLR, EOG, ERF, NOG, OAS, WLL ) over the Q1’14 to Q1’16 period. During the nine quarters, operators reduced average LOE expense by 37%.
Source: EnerCom Analytics
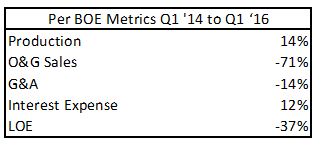
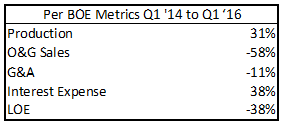
The table to the right shows the change in production, oil and gas sales per BOE, G&A per BOE, interest expense per BOE and LOE per BOE for the Bakken peer group. Even during this down cycle, operators have been able to grow production 14% between Q1’14 and Q1’16.
The summary data below show that since year-end 2014, drilling and completions costs declined 26% while IP rates and EURs have increased 30% and 41%, respectively. Increasing IP rates and EURs have shifted the average Bakken decline curve upward while lower D&C costs have nearly halved breakeven costs.
Based on current costs, average well size and EnerCom’s estimates of basin decline curves, operators in the Bakken wells are generating a 10% internal rate of return at $35.06 per barrel oil assuming a flat $2.50 per MMBtu natural gas price. Based on 2014 data, operators were breaking even on the average Bakken well at $61.89 per barrel.

Note: Estimated breakeven prices reflect realized prices.
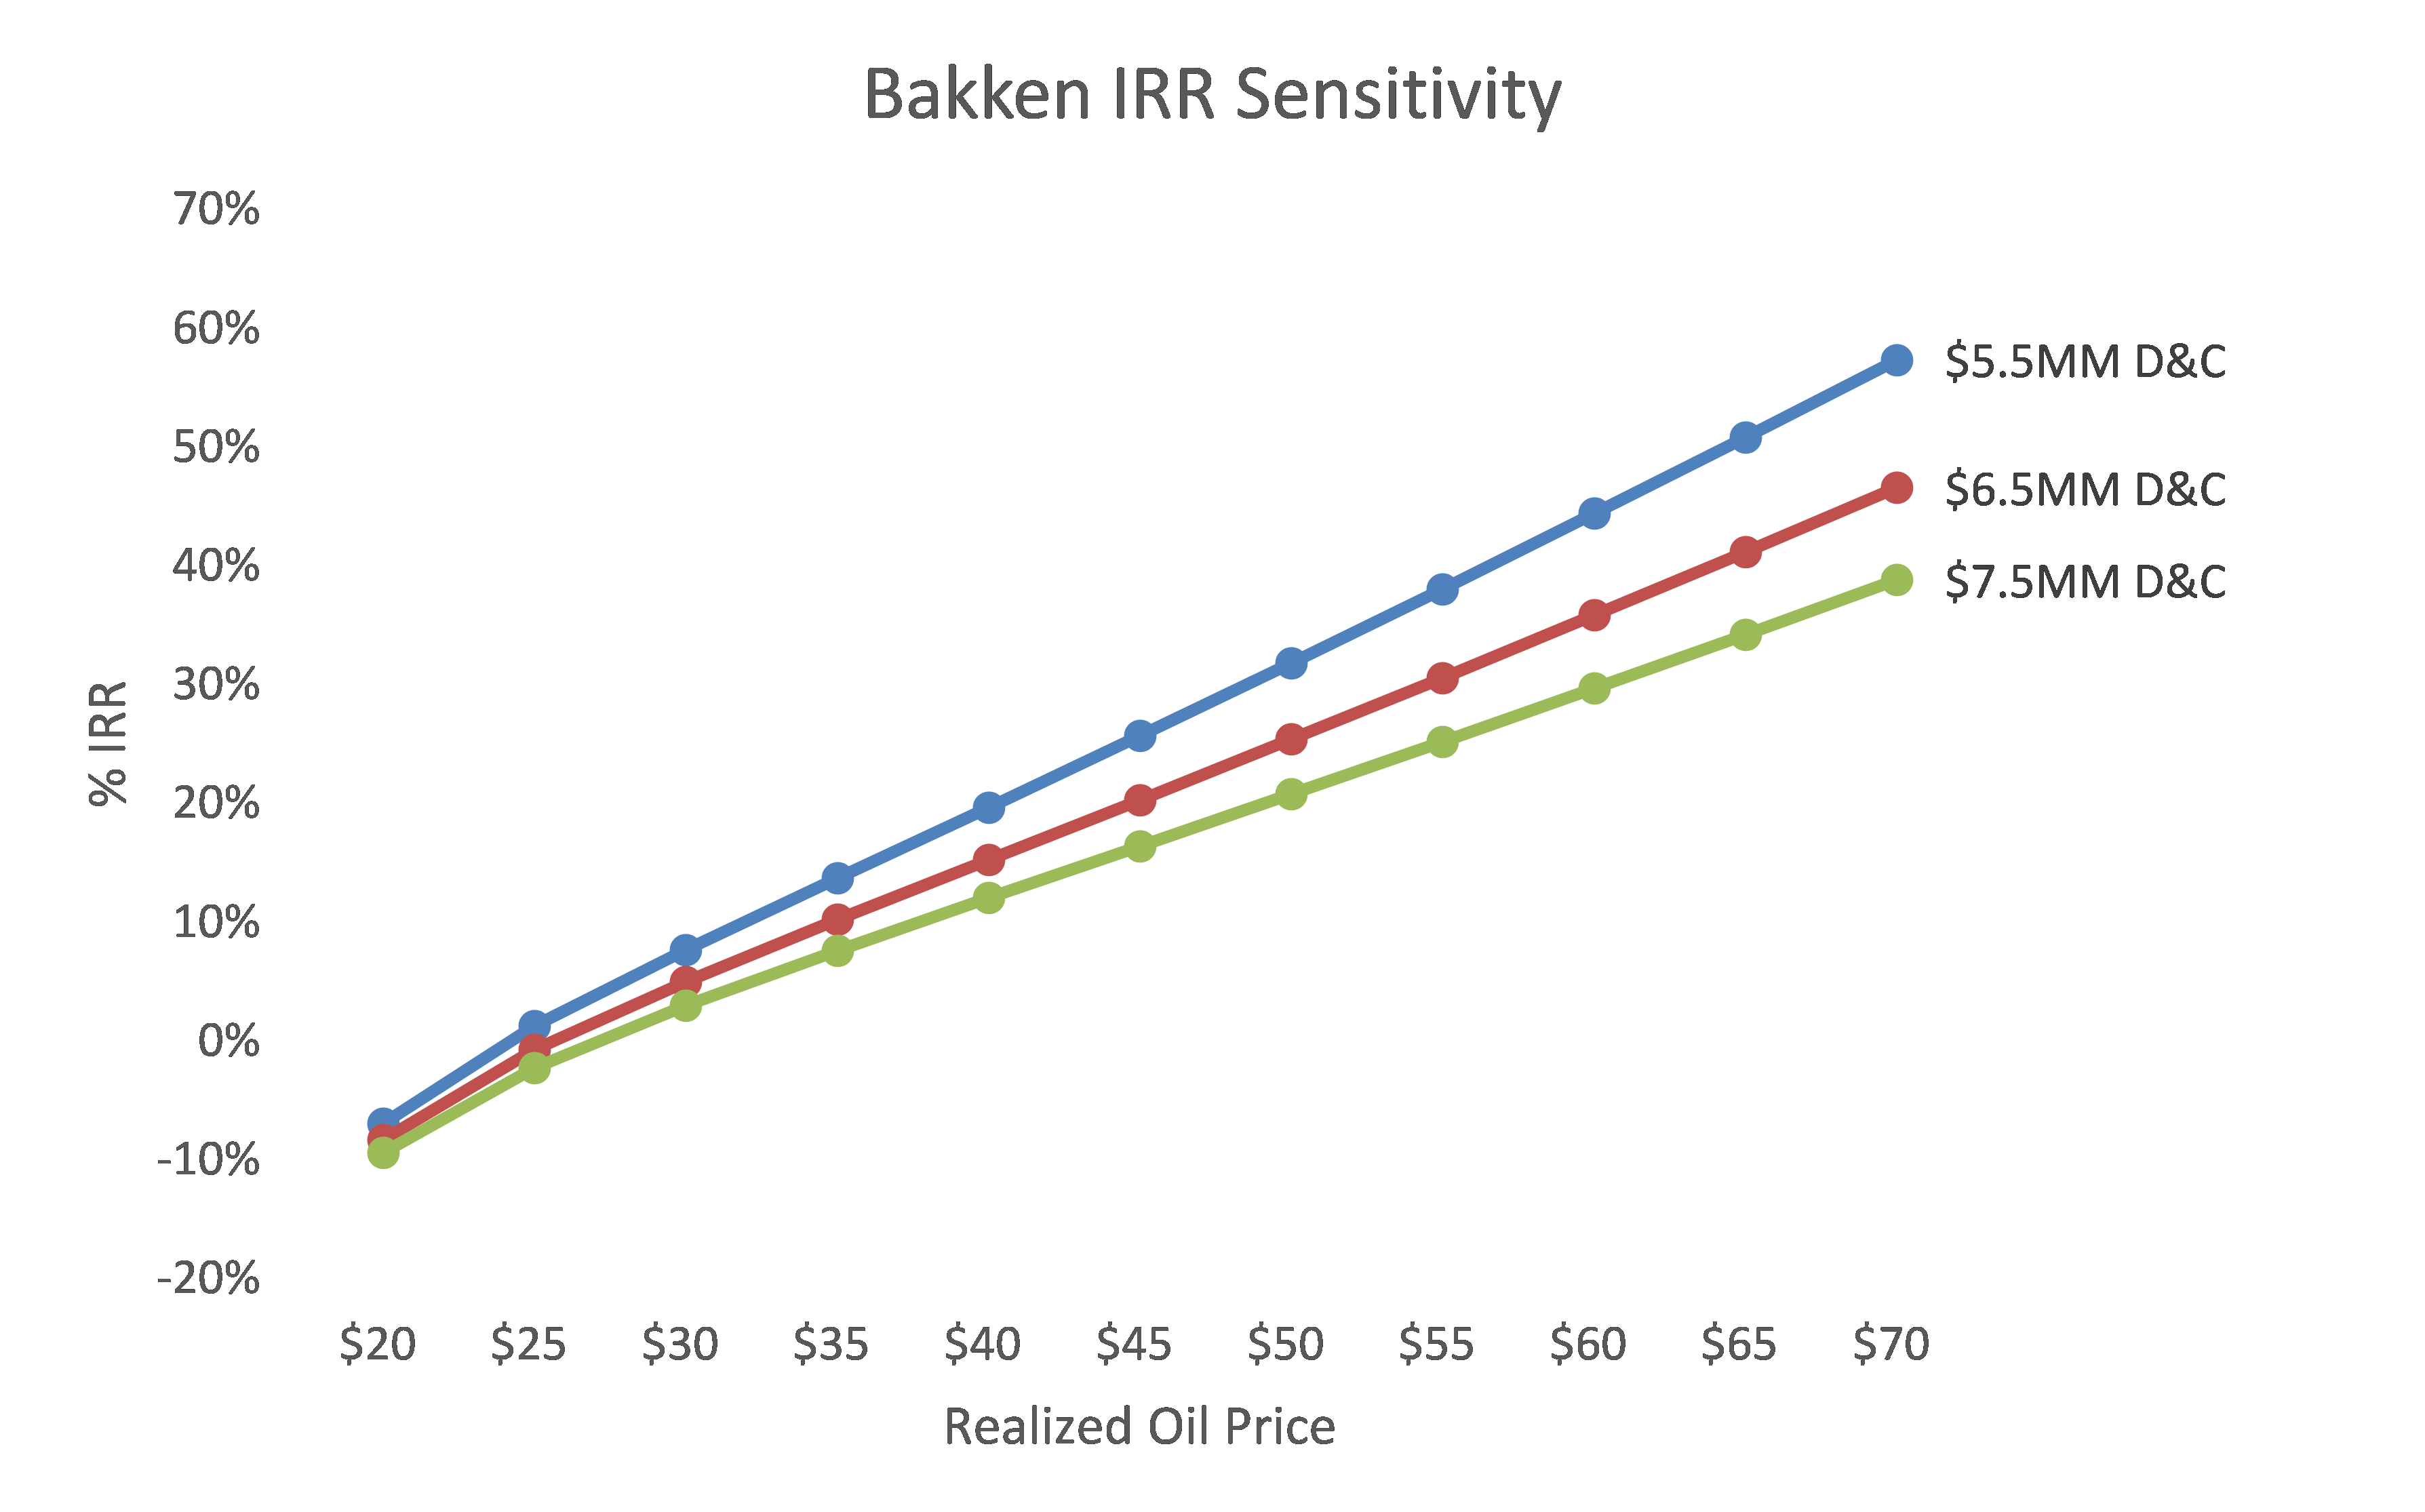
The chart below outlines the well economics sensitivity to drilling cost and oil price. Even if well cost increase to a $7.5 million level, operators can generate a 10% breakeven price $55.87 per barrel oil and $2.50 per MMBtu gas prices.
Source: EnerCom Analytics
In October of 2008, EnerCom published a report titled $50 per Barrel Oil & $5.00 per MMBtu Natural Gas. The report provided a framework for understanding the factors affecting commodity prices and market volatility with implications for energy companies during the financial crisis. In that report we summarized that “… given the stronger linkage between commodity prices and economic returns on drilling in shale plays, there could be an implicit floor for natural gas prices of approximately $5.00 per MMBtu. At that price, many shale plays become uneconomic (including overhead burdens). Persistently low prices would reduce drilling activity, causing a decline in production eventually requiring an upward price signal to increase drilling and supply. In addition, we suggest that the implicit ceiling for domestic natural gas prices is the competitive world price for LNG. So long as LNG prices outside the United States substantially exceed the domestic price, we do not see a rational economic case for sustained LNG imports.”
Well, the industry reduced costs and improved per-well economics and now $5.00 natural gas prices make most gas plays not only work, but make them very profitable. That said, we have seen the stronger linkage between commodity prices and economic returns through how quickly the industry idled drilling rigs as prices drop.
Leading the economics path for gas play economic is the Marcellus shale. The Marcellus shale play runs through northern Appalachia, primarily in Pennsylvania, West Virginia and Ohio. The formation runs approximately 600 miles north to south, and is estimated to hold as much as 500 trillion cubic feet of natural gas, about 160 Tcfe of which is recoverable using current technology. With what operators are doing in the field today, this recoverable estimate is likely to increase.
Efficiencies by the Numbers – Marcellus
EnerCom, using it database, analyzed lease operating expense data (LOE) by quarter for Marcellus focused companies (AR, COG, EQT, RICE, RRC, SWN) over the Q1’14 to Q1’16 period. During the nine quarters, operators reduced average LOE expense by 8%.

Source: EnerCom Analytics
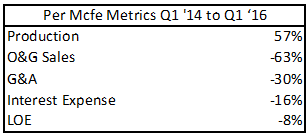
The table to the right shows the change in production, oil and gas sales per Mcfe, G&A per Mcfe, interest expense per Mcfe and LOE per Mcfe for the Marcellus peer group. Even during this down cycle, operators have been able to grow production 57% between Q1’14 and Q1’16. Even with that impressive production growth, Marcellus operators turned to their balance sheets as a source to reduce costs. Interest expense decreased 16% over that time period.
The summary data below show that since year-end 2014, drilling and completions costs declined 24% while IP rates and EURs have increased 14% and 44%, respectively. Increasing IP rates and EURs have shifted the average Marcellus decline curve upward while lower D&C costs have more than halved breakeven costs.
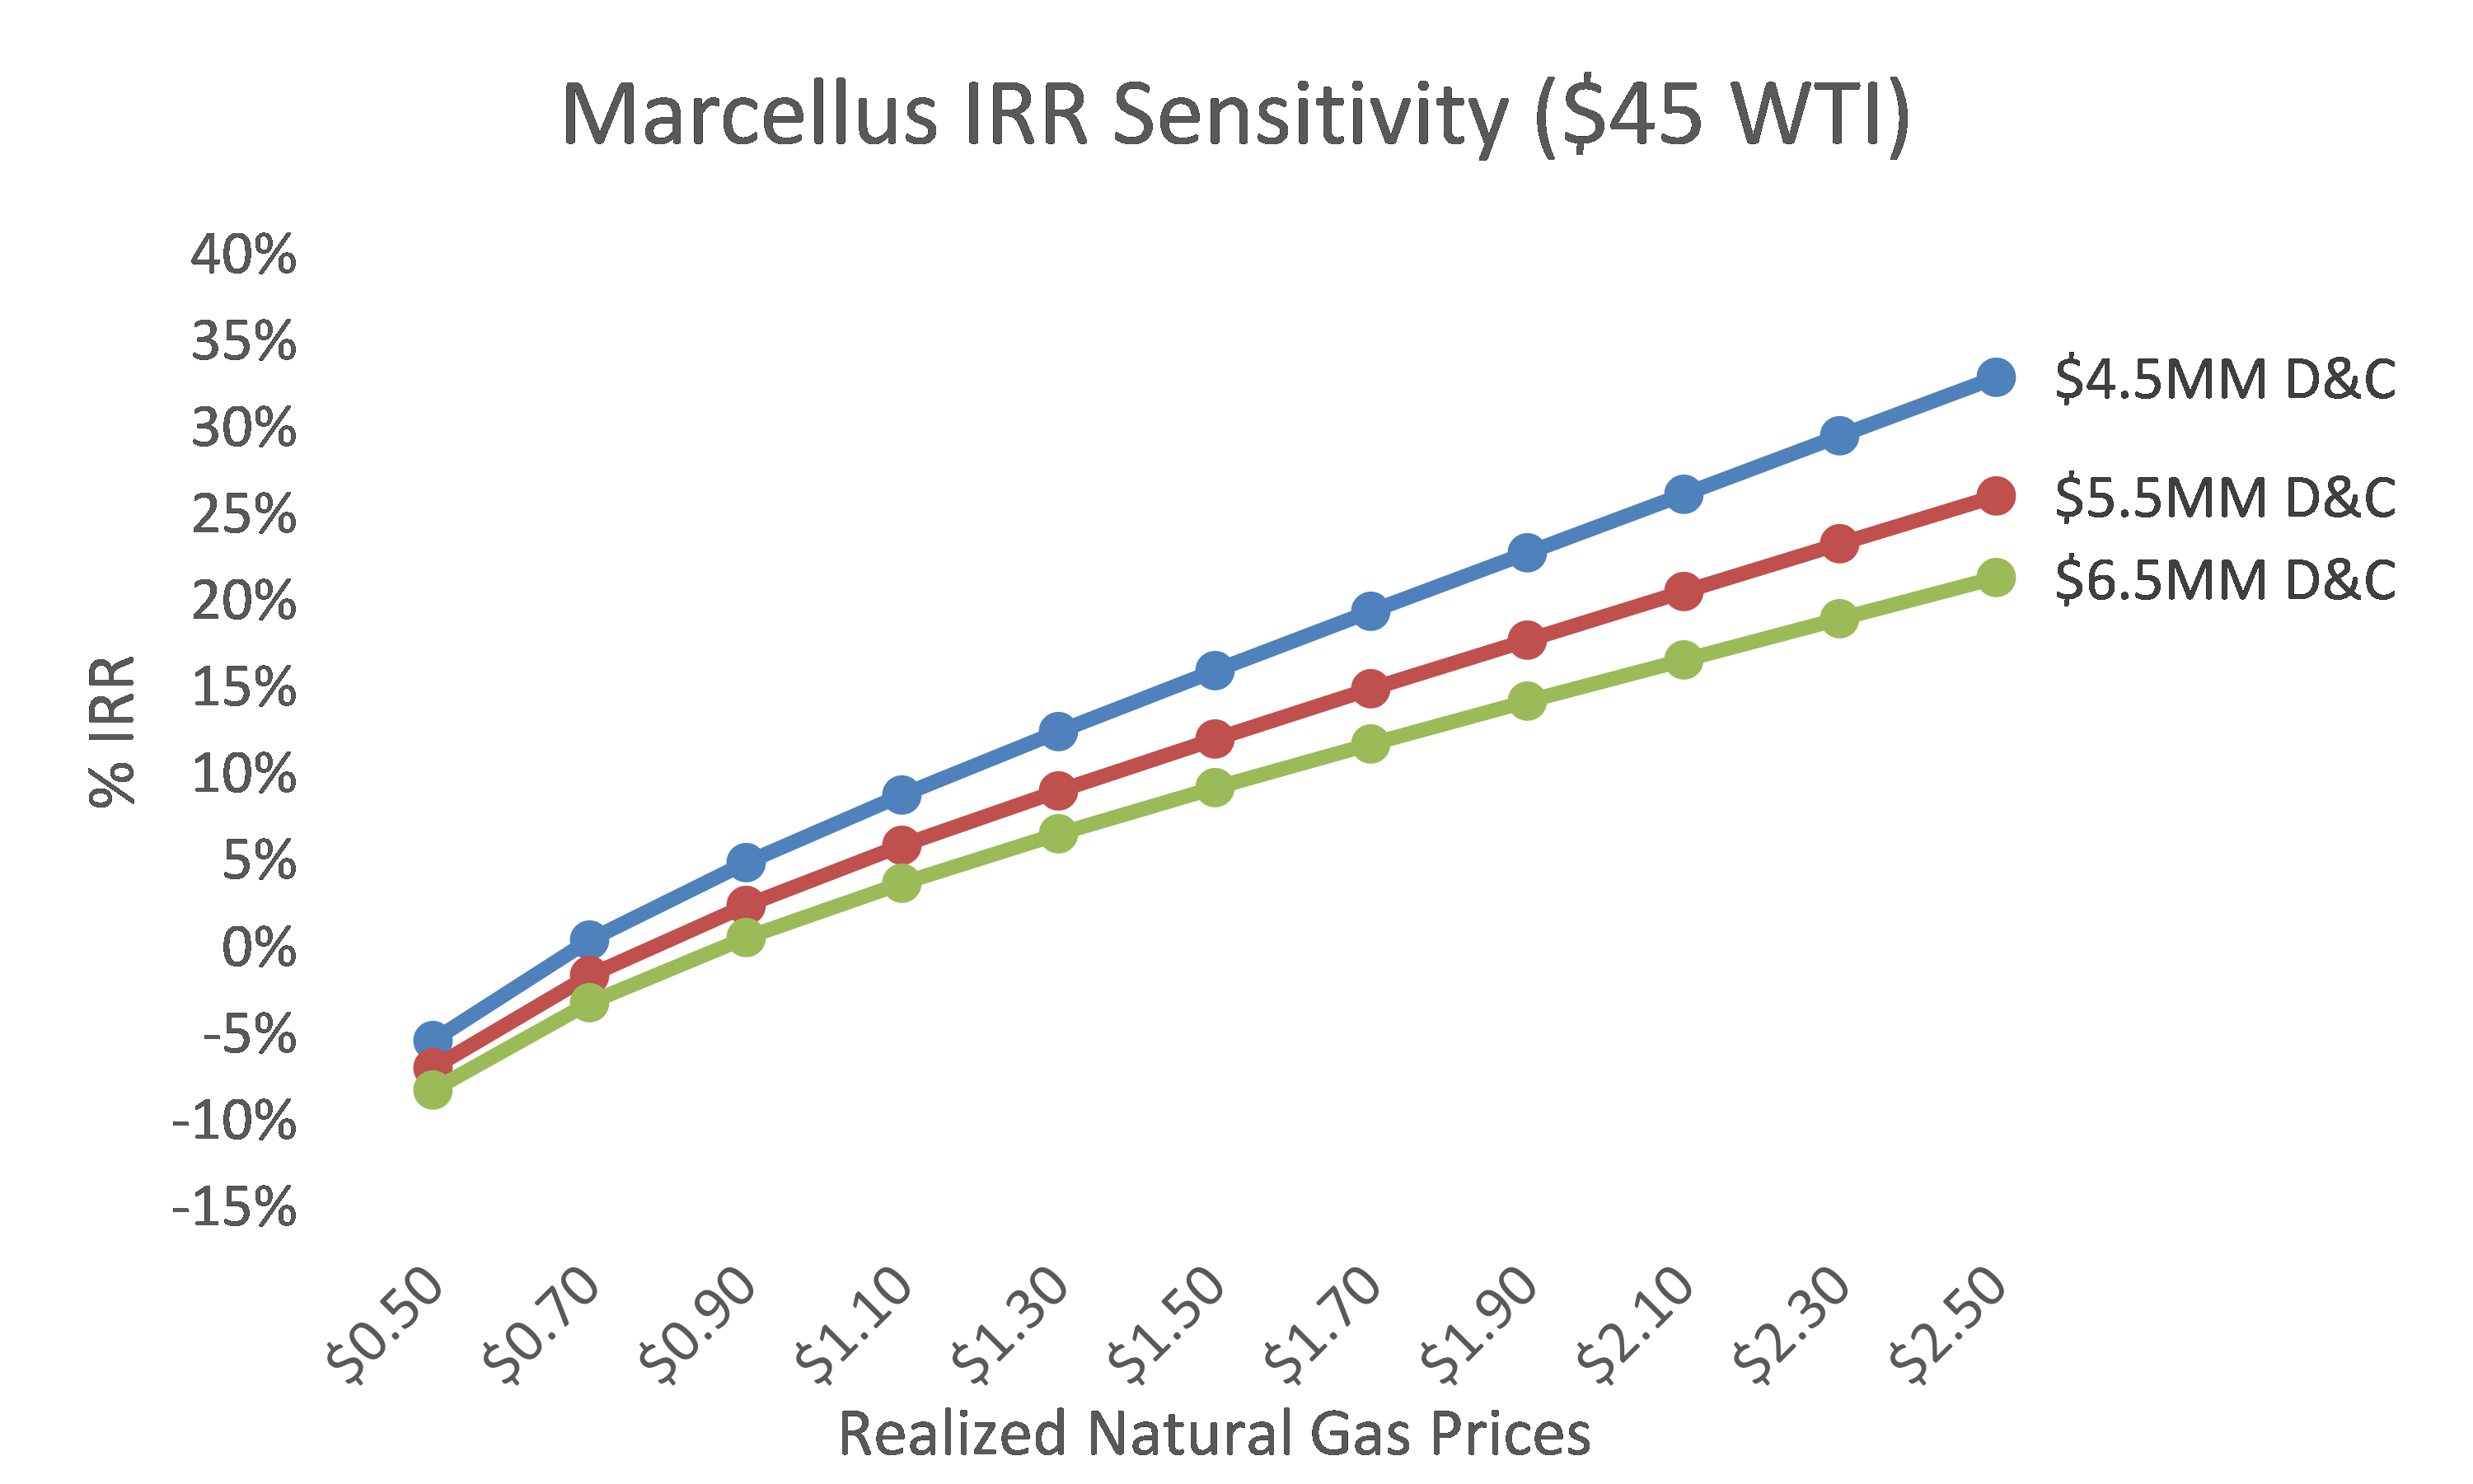
Based on current costs, average well size and EnerCom’s estimates of basin decline curves, operators in the Marcellus are generating a 10% internal rate of return at $1.38 per MMBtu gas prices assuming a flat $45.00 per barrel oil price and 60% of WTI NGL pricing. Based on 2014 data, operators were breaking even on the average Bakken well at $2.32 per MMBtu.

Note: Estimated breakeven prices reflect realized prices.
The chart below outlines the well economics sensitivity to drilling cost and oil Price.
Source: EnerCom Analytics
Efficiencies by the Numbers – Permian
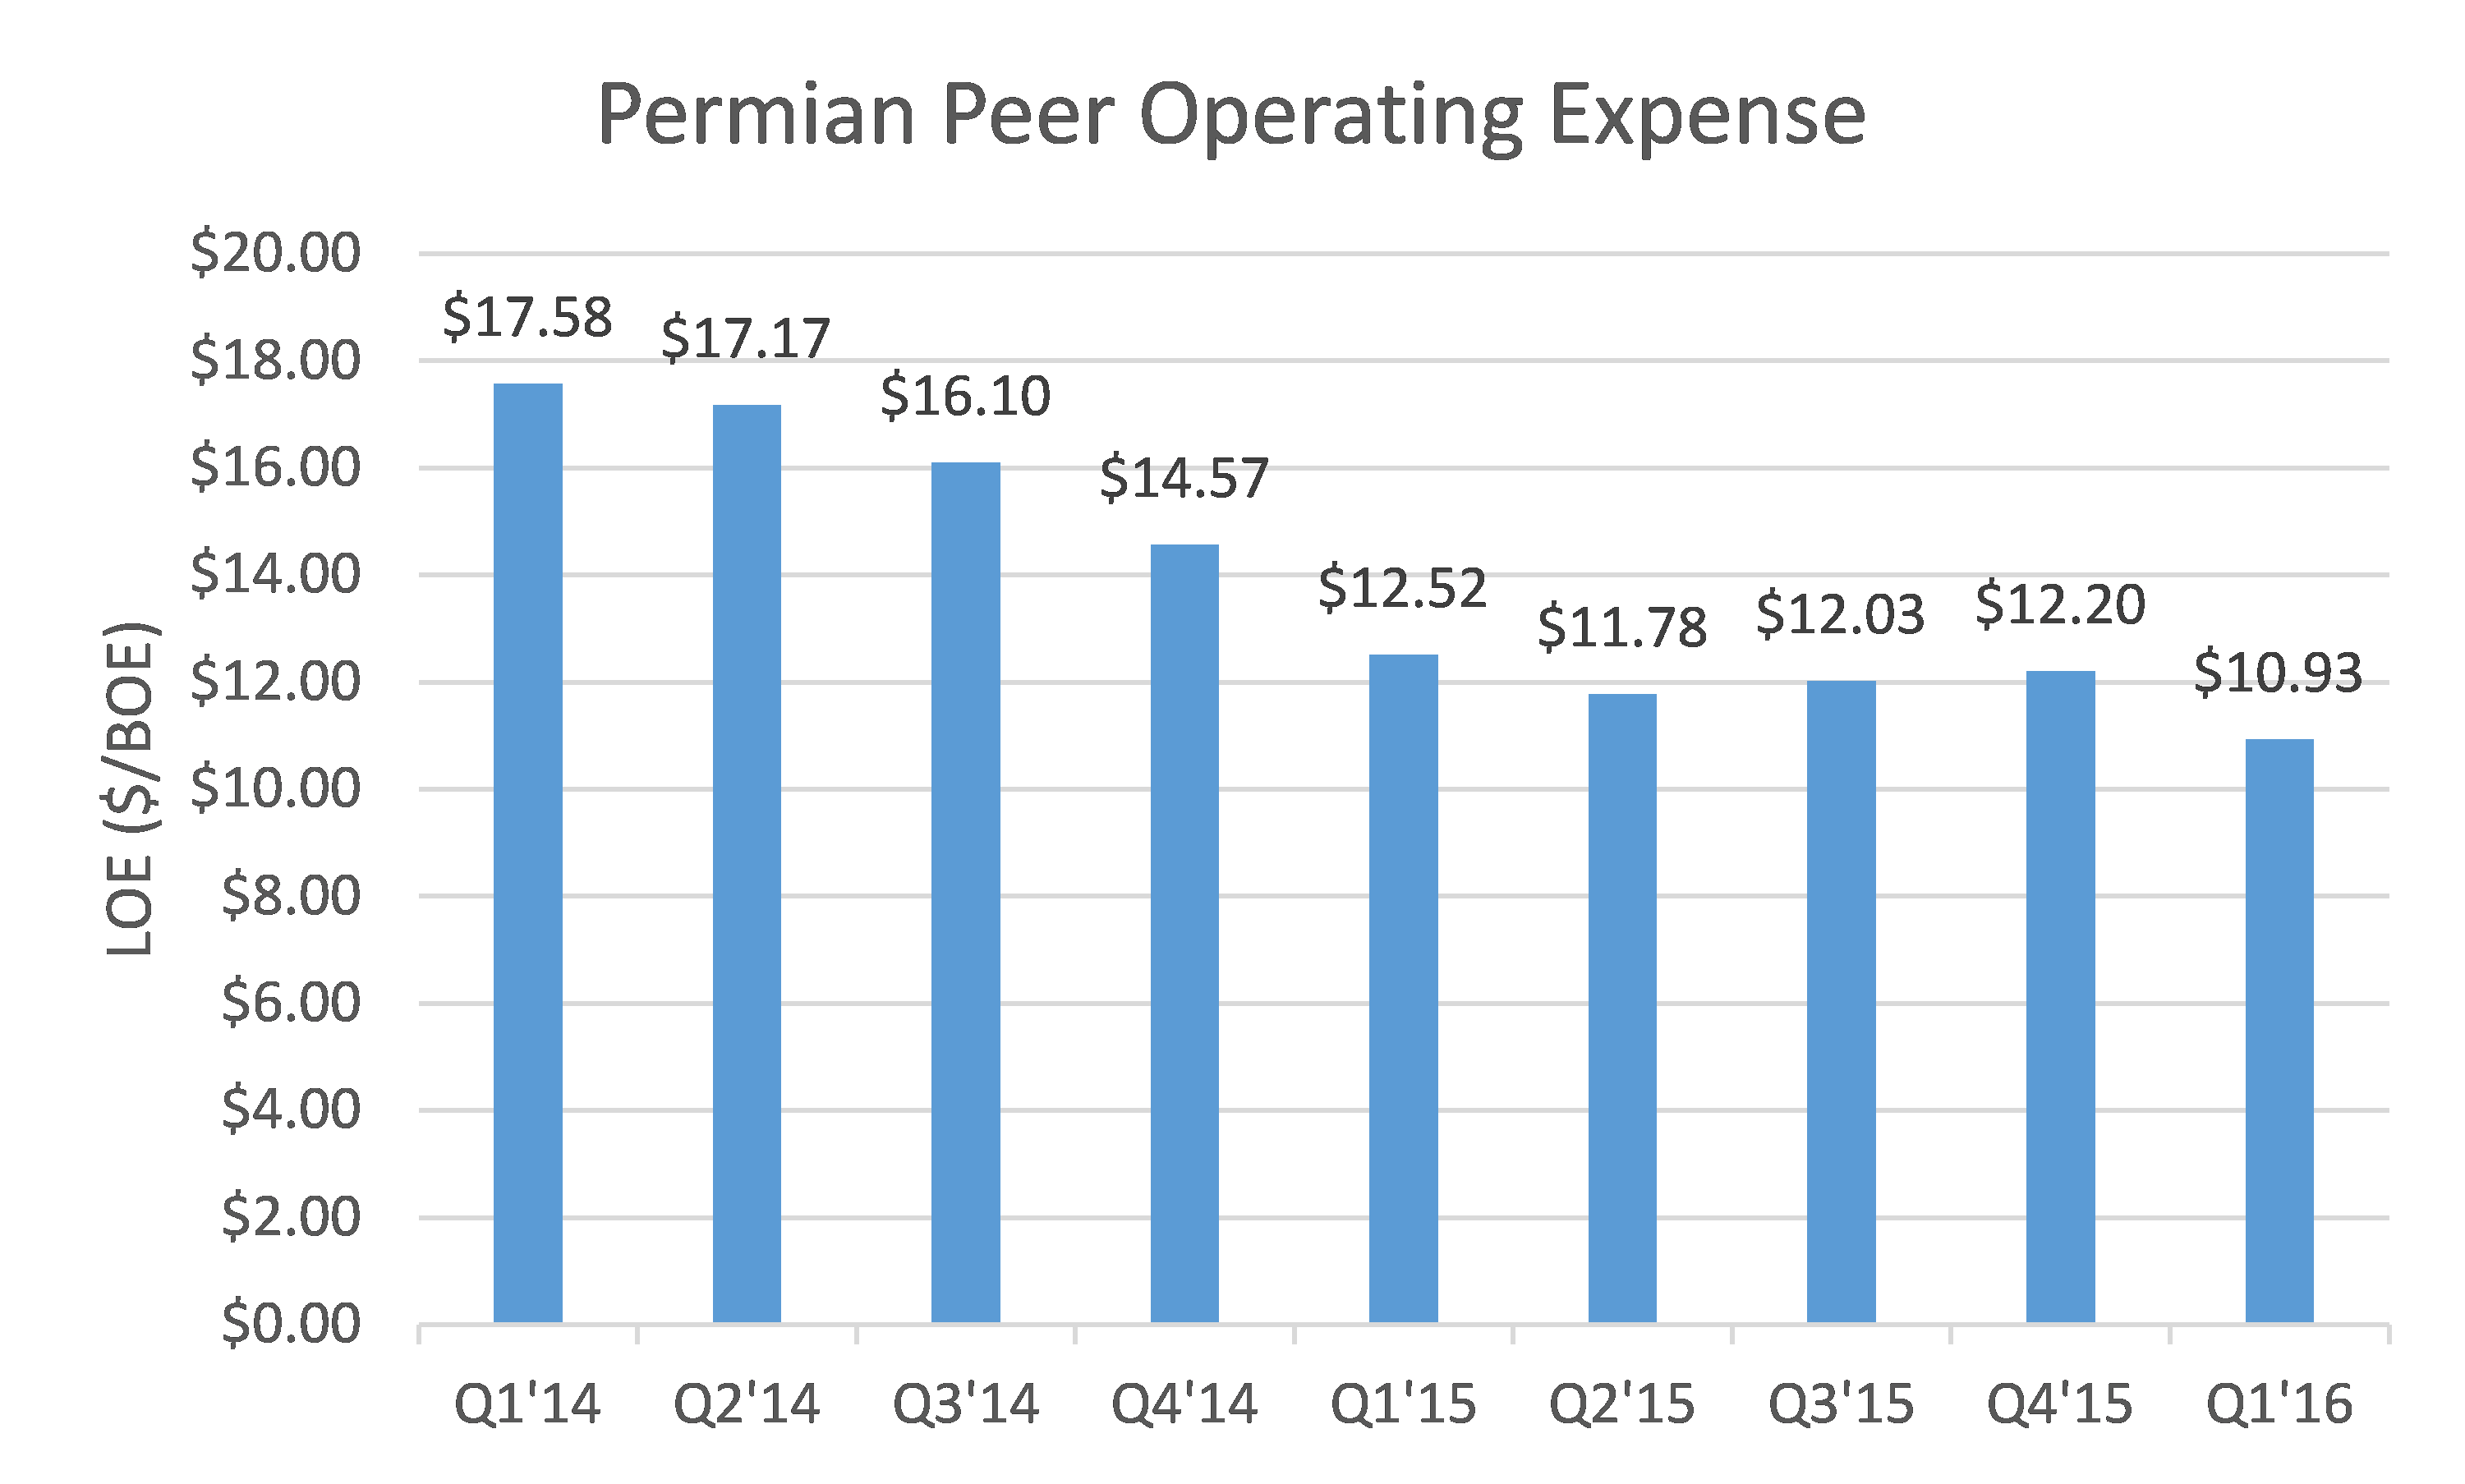
EnerCom, using it database, analyzed lease operating expense data (LOE) by quarter for Permian focused companies (AREX, CXO, PXD, REN, XEC) over the Q1’14 to Q1’16 period. During the nine quarters, operators reduced average LOE expense by 38%.
Source: EnerCom Analytics
The table to the right shows the change in production, oil and gas sales per BOE, G&A per BOE, interest expense per BOE and LOE per BOE for the Permian peer group. Even during this down cycle, operators have been able to grow production 31% between Q1’14 and Q1’16.
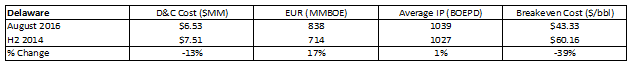
The summary data below show that since year-end 2014, Delaware Basin drilling and completions costs declined 13% while IP rates and EURs have increased 1% and 17%, respectively.
Midland Basin drilling and completions costs declined 13% while IP rates and EURs have increased 20% and 49%, respectively.
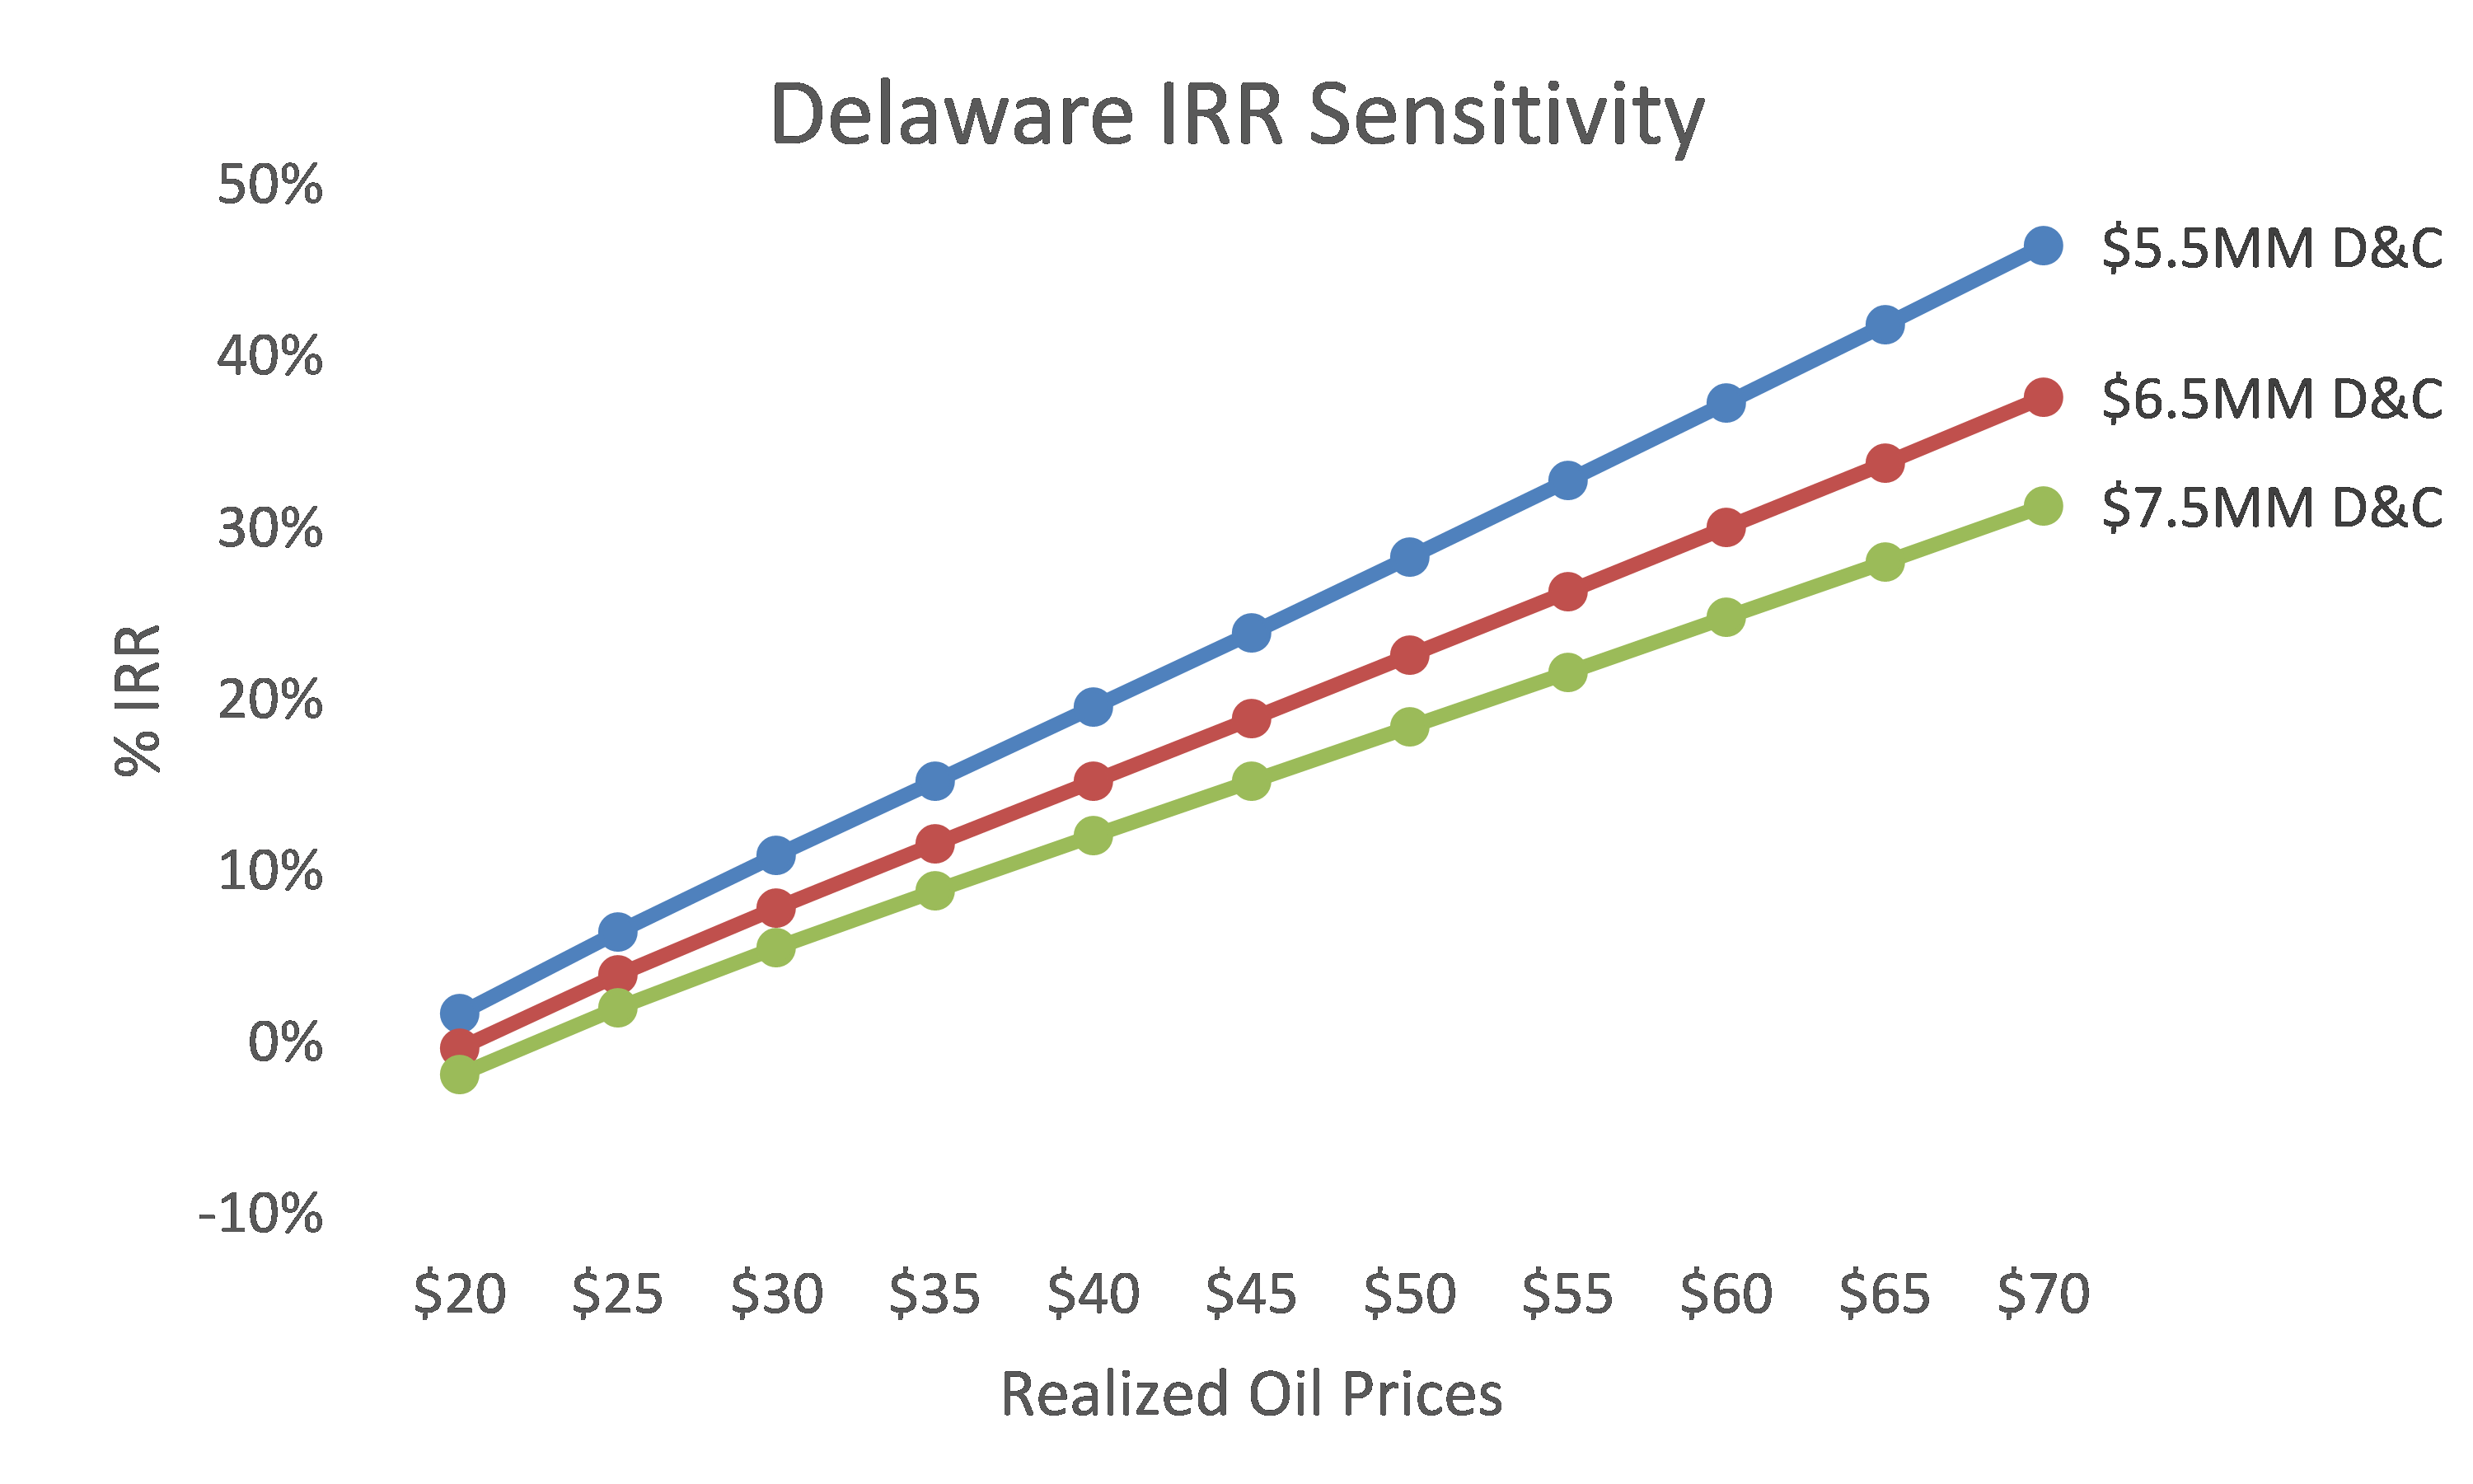
Based on current costs, average well size and EnerCom’s estimates of basin decline curves, operators in the Delaware are generating a 10% internal rate of return at $43.33 per barrel oil assuming a flat $2.50 per MMBtu natural gas price. Based on 2014 data, operators were breaking even on the average Delaware well at $60.16 per barrel.
Note: Estimated breakeven prices reflect realized prices.
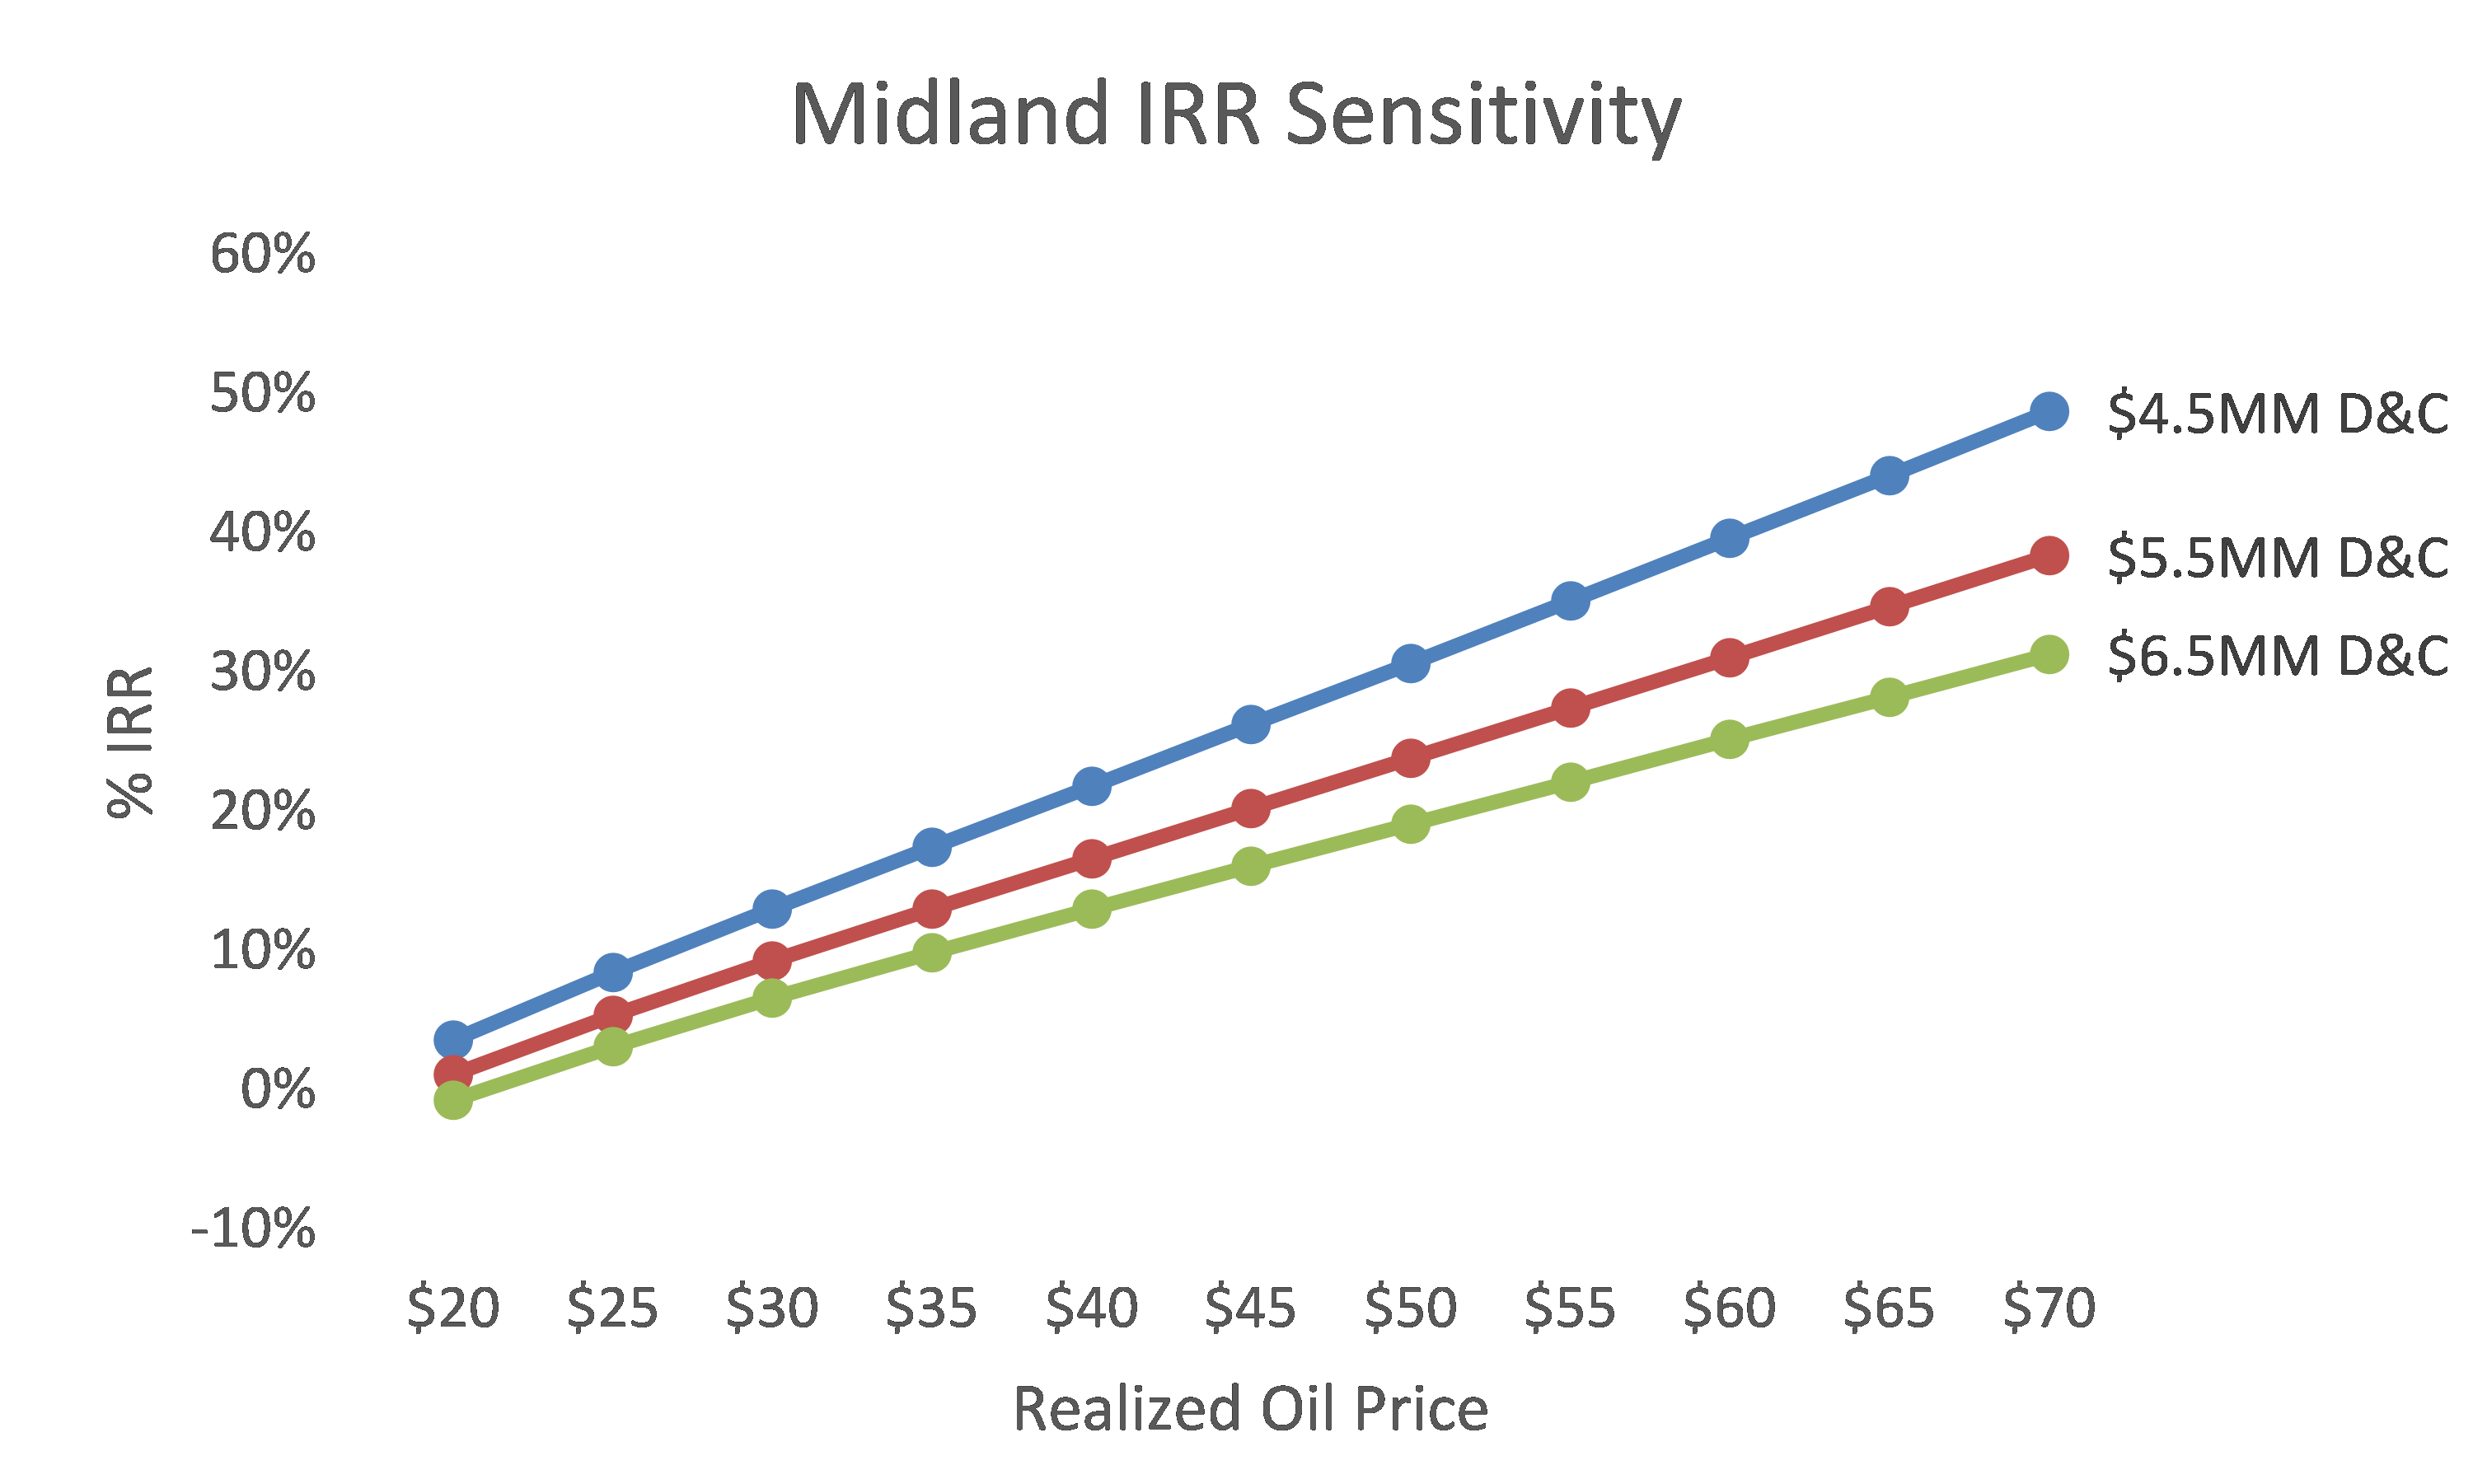
Operators in the Midland are generating a 10% internal rate of return at $41.17 per barrel oil assuming a flat $2.50 per MMBtu natural gas price. Based on 2014 data, operators were breaking even on the average Midland well at $63.06 per barrel.

The chart below outlines the well economics sensitivity to drilling cost and oil Price in the Delaware and Midland Basins.
Source: EnerCom Analytics
Source: EnerCom Analytics
Sink or Swim. We are Moving!
Taking some artistic liberties with Dylan’s song, it’s easier to see how he knew. And now we know. And knowing makes for a better future.
“If your capital to you
Is worth savin’
Then you better start swimmin’
Or you’ll sink like a stone
For the times they are a-changin’.”
We know from the numbers that capital is worth saving, and that the industry is swimming like an American named Phelps.
