Chart of Week

Source: Company Presentations

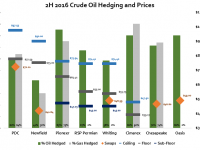
E&Ps Implementing Variety of Hedging Strategies

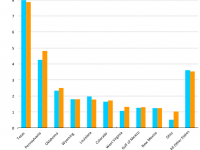
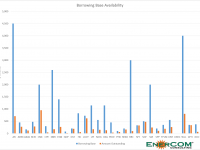
Hedging programs that E&Ps have in place in 2016 vary considerably. The chart below shows the range of oil and gas production for several E&Ps covered by hedging contracts.

Pioneer Natural Resources (ticker: PXD) and Cimarex Energy (ticker: XEC) have …

Crude Oil Futures:  Who’s Long and Who’s Short?

Crude Oil Futures:  Who’s Long and Who’s Short?

A presidential commission tracks the crude oil positions that are reported each week: this week producers and processors are short, while managed money is long oil

In its Weekly Commitment of Traders Report released every Friday, the United States Commodity

Is the U.S. Government Too Big to Fail?

Is the U.S. Government Too Big to Fail?

Assets: South of $5 Trillion; Liabilities: North of $21 Trillion

In February of each year, the Government Accountability Office puts out an updated snapshot of the books, written in plain language. Since Congress is working and this is an election …

Source: EIA

U.S. Gas Production, Consumption Hits Record in 2015

The market for natural gas continues to grow as the U.S. currently produces and consumes more gas than ever before, according to EIA’s 2015 Natural Gas Annual.

Prices for consumers continue to decline, although residential pricing for heating remains highest …

DUCs Amok? Oil and Gas 360® Examines Dueling EIA and Bloomberg Backlog Data

DUCs Amok? Oil and Gas 360® Examines Dueling EIA and Bloomberg Backlog Data

Well Backlog a Critical Piece of the Puzzle as the Market Seeks to Predict what Happens in a Recovery

DUCs, or drilled but uncompleted wells, have been a major topic of discussion among analysts for more than a year. …

History Says the Right Price for Oil is $50

History Says the Right Price for Oil is $50

EnerCom Analytics’ September Industry Trends Report Examines Oil Prices

The current price of oil may feel low given the fading memories of $100 per barrel oil back in 2014. But in a longer term historical context, we are on the …

Oil Market Sentiment on Wild Ride After 2015

Oil Market Sentiment on Wild Ride After 2015

WTI Volatility Index at Elevated Levels Since Price Crash

Prior to the fall 2014 crash in oil prices, volatility in the oil markets had been on a steadily decreasing trend. An examination of futures volatility in the post-crash period, however, …

U.S. Imports from OPEC decreasing consistently since 2010

OPEC Crude Imports by U.S. Consistently Decrease, while Non-OPEC Imports Increase

Total U.S. Crude Oil Imports Decline 4% from 2010

According to the EIA, U.S. imports of crude oil from OPEC nations have been consistently decreasing since 2013. On the other hand, non-OPEC imports have been consistently increasing, driven primarily by …

September 6, 2016 - 6:29 pm Analytics, Chart of Week, Closing Bell Story‎, International, OPEC
U.S. Spent $991 Million per Day on Petroleum Products in 2015

U.S. Spent $991 Million per Day on Petroleum Products in 2015

Every day in 2015, the United States spent $991 million on petroleum consumption, the lowest daily total since 2008. Consumption levels in the U.S. have decreased slightly to 19.72 MMBoepd since peaking in 2007 at 20.94 MMBoepd.

To determine spending …

U.S. Holds More Total Oil Resources than Any Other Country According to New Estimates

U.S. Holds More Total Oil Resources than Any Other Country According to New Estimates

Data includes estimates of yet to be discovered resources

The U.S. has taken a new place atop the list of countries with the largest recoverable oil resource potential in the world. This places the U.S. ahead of Russia and Saudi …

Source: EIA

Total U.S. Energy Production Up 2% YoY, 80% from Fossil Fuels

Domestic U.S. energy production of 89 quadrillion Btu accounted for 80% of U.S. energy supply: EIA

U.S. energy production totaled 89 quadrillion Btu in 2015, according to the latest information from the EIA. Domestic production increased 2 quadrillion Btu, or …

Dow Jones Industrials – Is the Money Flow a Good Indicator of Market Direction?

Dow Jones Industrials – Is the Money Flow a Good Indicator of Market Direction?

DJIA

Bullish or bearish?

The chart above shows the total amount of money since August 2, 2011 that has been invested in the Dow Jones Industrial Average (DJIA) – the index – by institutional investors and retail investors via various forms …

Persistently Low Commodity Prices will Hold Back Exporting Countries’ Growth: World Bank

Persistently Low Commodity Prices will Hold Back Exporting Countries’ Growth: World Bank

Bank Downgrades Global Growth for 2016 – Commodity Exporters are Expected to Grow 5.4% Less than Importers

 World Bank Imports and Exporter GDP Growth

The World Bank released its economic growth outlook for 2016 Tuesday, reducing its expectations from earlier this year. The bank anticipates global economic …

Graph: Bloomberg, Natural gas five-day chart

Natural Gas at 5-Month High as Market Tightens

Natural gas prices up again today on bullish storage data

Natural gas prices rose to a five-month high today as information from the Department of Energy showed natural gas markets are tightening. Economist were expecting a build of 83 Bcf …

Natural Gas-Fired Power Plants Being Constructed Near Major Shale Plays

Natural Gas-Fired Power Plants Being Constructed Near Major Shale Plays

nat gas plants

Electrical generation from natural gas fired plants increased 19% in 2015 due to lower natural gas prices and increased legislation on carbon emissions. Coal and natural gas are now neck and neck in electrical generation capacity with EIA projecting natural …

Crude Oil and Rig Count Move in Unison

Crude Oil and Rig Count Move in Unison

As of last week, rig count is 78% lower than the previous low in 2010

Rig Chart


Crude oil price and rig count have moved primarily in conjunction with one another over the years. Rig count has fallen 81% since the …

Crude Oil Volatility Decreases

Crude Oil Volatility Decreases

Crude oil price volatility has declined since its peak in March according to a report from the EIA on May 10, 2016.

During the first three months of 2016, crude oil prices were relatively more volatile than in recent history. …

U.S. Energy Consumption: Oil and Gas are Still King at 62% of the Market

U.S. Energy Consumption: Oil and Gas are Still King at 62% of the Market

Primary Energy Consumption by Source and Sector – 2014


This graphic from the EIA helps visualize some of the data leaking out of the agency’s massive knowledge vault. In their measure for total U.S. energy consumption in 2014, they …

North America = Net Exporter of Liquids by 2021:  BP

North America = Net Exporter of Liquids by 2021: BP

Slowing demand and increasing production puts North America on track for net liquids exports

North America expected to export liquids starting 2021

BP (ticker: BP) released its 2016 Energy Outlook – Focus on North America today. In the repost it forecasts that increasing oil and gas production, mixed …

Borrowing Base Availability by Company

Borrowing Base Availability by Company

How Much Borrowing Base will be Left after Redeterminations?

Bankruptcy and restructuring have become prevalent words in the oil and gas industry during the present price downturn. With spring borrowing base redeterminations already under way or quickly approaching, speculation is …

Natural Gas: Cheap Fuel with Low Carbon Emissions

Natural Gas: Cheap Fuel with Low Carbon Emissions

And the U.S. Has an Abundance of It

Here’s another bit of energy upside, and it’s something for the shale gas producers to cheer about. The EIA released its 2015 power generation fuel data and natural gas was behind coal …

Canadian Oil Sands Production Expected to Increase: EIA

Canadian Oil Sands Production Expected to Increase: EIA

New Canadian oil sands projects are more costly to shut down than continue running

EIA Canadian Oil Sands Production

Despite lower oil prices, Canadian oil sands production is expected to continue growing, and be the main driver behind increased Canadian production as a whole, in …

Gulf of Mexico Production Expected to Reach Record High in 2017

Gulf of Mexico Production Expected to Reach Record High in 2017

Gulf of Mexico production will account for 21% of U.S. production next year

Gulf of Mexico expected production

Production from the Gulf of Mexico is expected to continue growing, despite the current price environment. With eight projects that came online in 2015, four expected in …

The Leading Source of Oil in 2035—It’s Not OPEC:  BP

The Leading Source of Oil in 2035—It’s Not OPEC: BP

Non-OPEC unconventional sources expected to provide growth in supply through 2035

BP 2016 Energy Outlook Supply Growth

The continued growth of global economies will continue to drive demand for energy around the world, according to BP’s (ticker: BP, BP.com) 2016 Energy Outlook.

According to the …

$20 Oil Not New to Some Producers

$20 Oil Not New to Some Producers

Certain crude grades from around the globe are already at or below $20 per barrel

Oil and gas prices for the U.S. crude benchmark WTI, and international crude benchmark Brent, closed below $30 per barrel today, but some producers are …

The IPO that Was (and May Still Be):  How Big is Saudi Aramco?

The IPO that Was (and May Still Be): How Big is Saudi Aramco?

Last week, a Saudi crown prince dropped a bombshell in an under-the-radar interview that was published in The Economist. He said that the kingdom was looking into spinning off Aramco, or some portion of it, to raise cash.

Comments regarding

U.S. Oil Prices: Export Ban Lifts, See What Happens

U.S. Oil Prices: Export Ban Lifts, See What Happens

The Brent/WTI spread disappears

Last Friday, Dec. 18, the United States Senate adopted the Omnibus Appropriations Act by a vote of 65-33 as did the House of Representatives by a 316-113 vote. Later that day, President Obama then signed into …

Oil and Gas Spending Cuts Already Apparent for 2016

Oil and Gas Spending Cuts Already Apparent for 2016

The year over year drops in 2015 capital expenditures were significant, but apparently not significant enough.

Budgets for 2016 are trickling onto the newswires, and some of the largest companies in the business are pulling back on costs yet again. …

Comparing Global Oil Production, Consumption and Exports

Comparing Global Oil Production, Consumption and Exports

Oil & Gas 360 - Global oil production, consumption, exports

Regardless of commodities prices, oil fuels the world’s economies. In this Chart of the Week, we look at which countries are producing, consuming and exporting it.

Important disclosures: The information provided herein is believed to be reliable; however, EnerCom, Inc. …

OPEC Countries: When the Money Runs Out, Then What?

OPEC Countries: When the Money Runs Out, Then What?

Bridging the budget gap

Lower commodity prices have hurt the economies of all of OPEC’s members considerably, with many of them needing to borrow money to bridge the budget gap. Libya, in particular, is expected to need large loans through …