In this week’s Oil & Gas 360®’s chart of the week, we compare the number of oil and gas rigs during the 2008 economic downturn and today’s low commodity environment. The price used for WTI is the annual average of the one-month forward price.
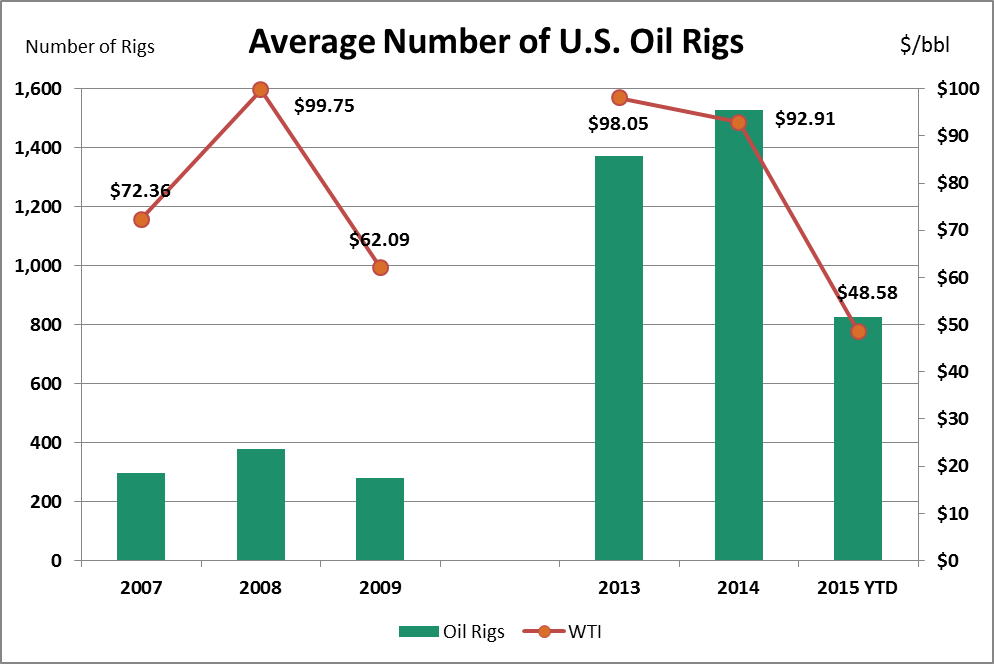
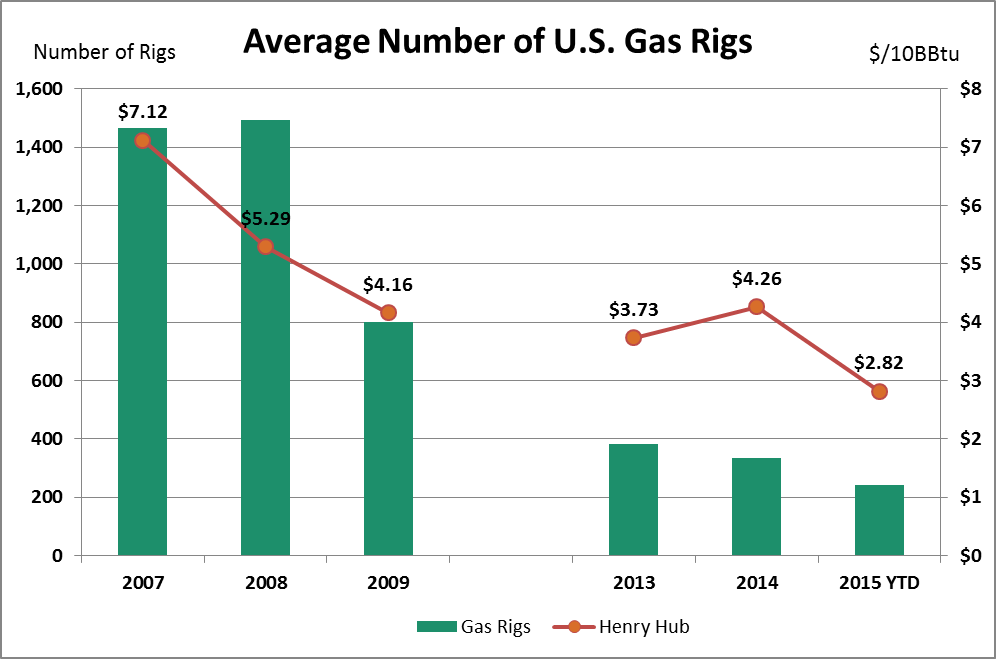
During the last down cycle, from 2007 to 2009, the number of rigs drilling for oil in the United States was about 75% lower than the number of rigs drilling for natural gas. This trend has flipped in the most recent price cycle, with natural gas prices sitting well below their $7.12 average from 2007. Now oil rigs make up three-fourths of the total drilling fleet, which is unsurprising given the 6:1 price difference between oil and natural gas which stands at roughly 18.6:1.
EnerCom Analytics:
There is a delay in the number of rigs falling compared to commodity prices when looking at the number of gas rigs in the last price cycle, and again in this current price cycle with oil rigs. At the beginning of January of this year, the number of active oil rigs was still at 1,421 rigs, even after prices fell drastically after OPEC’s Thanksgiving to maintain production. It has taken an additional three months of depressed prices for rig counts to drop along with the price per barrel of oil.
Over the last few years of $100 oil price environments, there has been significantly more exploration and drilling activity related to oil than to natural gas, as evidenced by the charts above. If the market has been correcting to new vast amounts of unlocked supply potential from the shale boon and the corresponding builds in U.S. production and storage, $100 oil price environments might be a thing of the past.
Further, if there is a new market equilibrium somewhere in the neighborhood of $70 to $80 per barrel of oil and between $4 and $5 per MMBtu of natural gas, it is plausible that companies shift from conveying a “liquids rich” message to the market and instead, begin to focus on having commodity balance within their drill plans that would allow them to allocate capital according to which commodity will provide the highest returns. As a result, rig allocations between oil and gas plays may also become a more even pronounced.
Important disclosures: The information provided herein is believed to be reliable; however, EnerCom, Inc. makes no representation or warranty as to its completeness or accuracy. EnerCom’s conclusions are based upon information gathered from sources deemed to be reliable. This note is not intended as an offer or solicitation for the purchase or sale of any security or financial instrument of any company mentioned in this note. This note was prepared for general circulation and does not provide investment recommendations specific to individual investors. All readers of the note must make their own investment decisions based upon their specific investment objectives and financial situation utilizing their own financial advisors as they deem necessary. Investors should consider a company’s entire financial and operational structure in making any investment decisions. Past performance of any company discussed in this note should not be taken as an indication or guarantee of future results. EnerCom is a multi-disciplined management consulting services firm that regularly intends to seek business, or currently may be undertaking business, with companies covered on Oil & Gas 360®, and thereby seeks to receive compensation from these companies for its services. In addition, EnerCom, or its principals or employees, may have an economic interest in any of these companies. As a result, readers of EnerCom’s Oil & Gas 360® should be aware that the firm may have a conflict of interest that could affect the objectivity of this note. The company or companies covered in this note did not review the note prior to publication.