The EIA’s latest tool for tracking crude shipments by rail shows massive increases in the past five years
The Energy Information Administration (EIA) announced that it will begin providing monthly data on rail movements of crude oil. The EIA has also released data on the growth of crude-by-rail (CBR) since 2010, showing exponentially growth in that time. CBR activity is tracked between pairs of Petroleum Administration for Defense District (PADD) regions (inter-PADD), within each region (intra-PADD) and across the U.S.-Canada border.
In 2010, the Williston Basin in North Dakota was the primary origin of the 55 MBOPD of CBR shipments. Rail tank cars were used mainly to move Bakken crude oil to the pipeline hub in Cushing, Oklahoma, with the remaining volumes being moved to the Gulf Coast and East Coast.

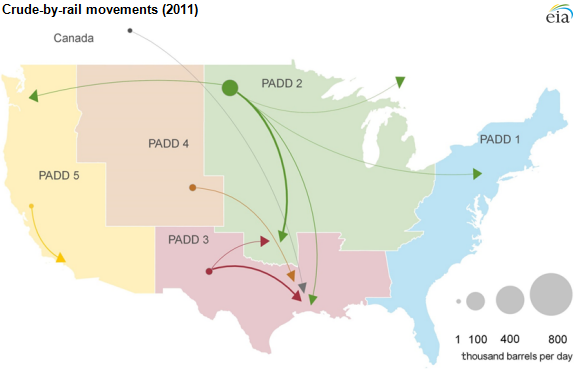
CBR quickly expanded in 2011, more than doubling from 2010 levels to 124 MBOPD. Shipments inside PADD 2 and from PADD 2 to PADD 3 (Gulf Coast refineries) accounted for most of the movement. Movement from the Midwest to the Gulf increased more than 400% to 36 MMBOPD in 2011. Bakken CBR to refineries on the East and West coasts both increased more than 200% from the previous year.
CBR shipments made another massive leap in 2012, with a total volume of 440 MBOPD, more than triple the amount from 2011. Almost all of the growth came from the Midwest PADD 2. The largest flow was from Midwest PADD 2 to PADD 3 in the Gulf. Crude by rail from Canada to U.S. refiners continue to expand, as did Niobrara crude from PADD 4.

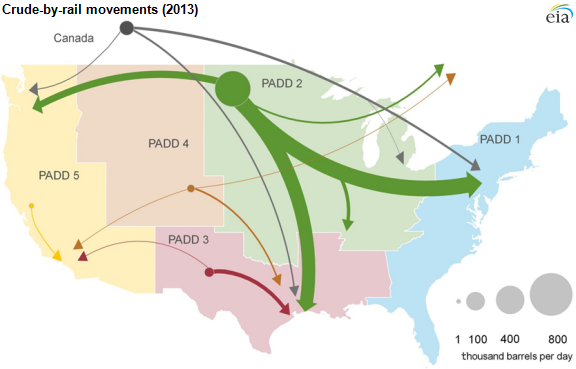
Total CBR movements nearly doubled again in 2013, reaching 816 MBOPD. Gulf Coast refineries received 352 MBOPD, or 43% of all crude moving by rail. Bakken crude from PADD 2 to coastal refineries dominated CBR shipments in 2013.
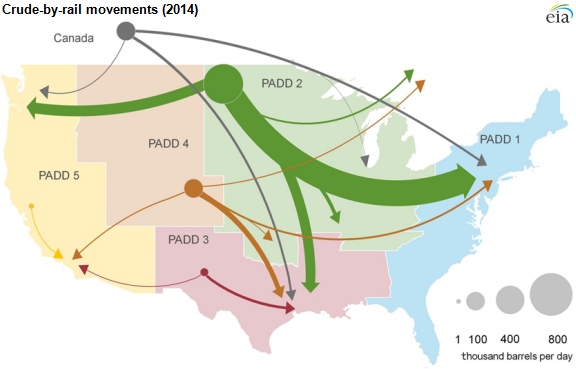
Growth in total CBR movements slowed in 2014, but the average CBR volume exceeded 1,000 MBOPD. Bakken crude from PADD 2 continued to dominate flows making up 70% of CBR volumes. Niobrara crude from PADD 4 grew in importance as the second-largest origin for rail shipments. East Coast refineries (PADD 1) were the primary destination for CBR receipts in 2014.
Growing pains in the Williston
Despite the massive growth in CBR volumes from the Williston Basin, production growth continues to outstrip transportation capacity. The Basin’s infrastructure almost immediately fell behind after the initial production boom in 2010, making Bakken crude more difficult to get to market. Because of the lacking infrastructure and sometimes harsh conditions in the region, the North Dakota budget estimations take a 15% discount to West Texas Intermediate.
Overall, 58% of oil transported out of the Williston Basin was taken by rail. Pipelines were responsible for transporting 35% of the crude oil that was produced in the region, while the Tesoro (ticker: TSO) refinery processed 6% of production and just 1% was transported by truck to Canadian pipelines.
Important disclosures: The information provided herein is believed to be reliable; however, EnerCom, Inc. makes no representation or warranty as to its completeness or accuracy. EnerCom’s conclusions are based upon information gathered from sources deemed to be reliable. This note is not intended as an offer or solicitation for the purchase or sale of any security or financial instrument of any company mentioned in this note. This note was prepared for general circulation and does not provide investment recommendations specific to individual investors. All readers of the note must make their own investment decisions based upon their specific investment objectives and financial situation utilizing their own financial advisors as they deem necessary. Investors should consider a company’s entire financial and operational structure in making any investment decisions. Past performance of any company discussed in this note should not be taken as an indication or guarantee of future results. EnerCom is a multi-disciplined management consulting services firm that regularly intends to seek business, or currently may be undertaking business, with companies covered on Oil & Gas 360®, and thereby seeks to receive compensation from these companies for its services. In addition, EnerCom, or its principals or employees, may have an economic interest in any of these companies. As a result, readers of EnerCom’s Oil & Gas 360® should be aware that the firm may have a conflict of interest that could affect the objectivity of this note. The company or companies covered in this note did not review the note prior to publication. EnerCom, or its principals or employees, may have an economic interest in any of the companies covered in this report or on Oil & Gas 360®. As a result, readers of EnerCom’s reports or Oil & Gas 360® should be aware that the firm may have a conflict of interest that could affect the objectivity of this report.