In October, OAG360 examined the internal rate of return (IRR) in two of America’s key shale basins – the Eagle Ford (EF) and Bakken. EnerCom’s analysis showed the Eagle Ford is more economic than its rival basin by a handful of percentage points, no matter the price.
Oil prices for West Texas Intermediate crude have hovered around the $75 per barrel mark for the past week, but both basins will still provide upside if the price slips to $70 by the end of the year. In a $70 per barrel environment, the EF and Bakken provide IRRs of 12.9% and 9.0%, respectively.
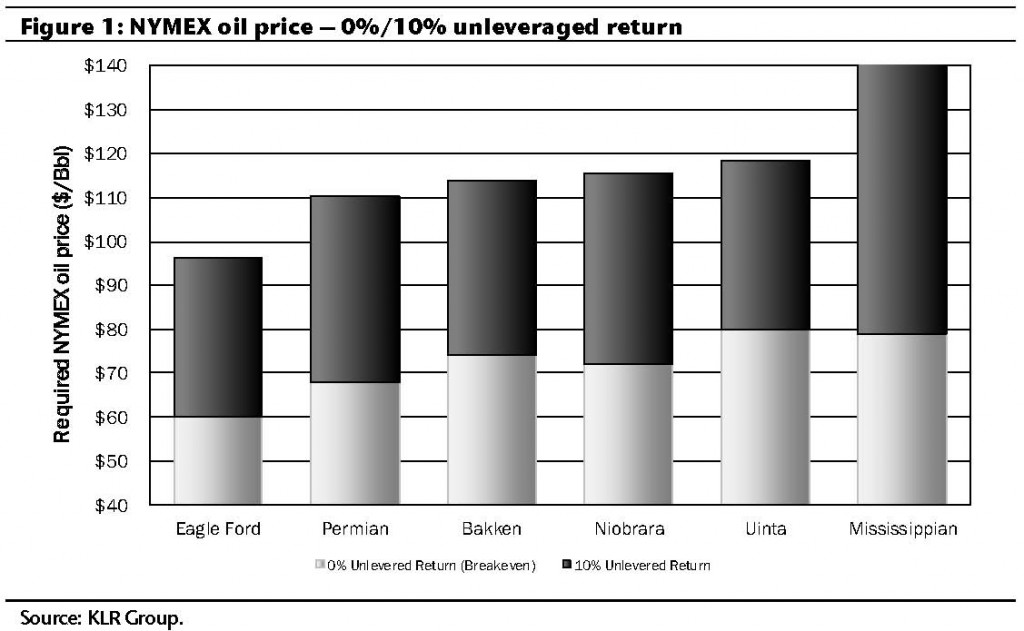
A report by KLR Group, released on November 19, 2014, supports the assessment of the Eagle Ford’s E&P-friendly economics. The report says the breakeven price for Eagle Ford wells is $60 – below breakevens of the Permian, Niobrara and Bakken, which can range from $68 to $74. KLR cites the EF’s lower capital intensity ($30/BOE) and “relatively high oil price netback ($2.50 below NYMEX) drive this advantaged outcome.”
Marcellus Leads the Gas Plays
Gas markets have already withstood the price cut rollercoaster that is currently plaguing oil, but the economics are still viable in the majority of large basins. Wet gas is the most economic, with breakevens of the wet Marcellus and wet Utica at $2.50 and $3.10 per thousand cubic feet (Mcf) respectively. Dry Marcellus gas is next in line at a $3.50 per Mcf breakeven. The Haynesville, Fayetteville and Barnett are more capital intensive, requiring prices ranging from $3.75 to $4.25 per Mcf. The latter three plays all have a higher price netback than the Appalachia region, which further proves the strength of the Marcellus/Utica plays.
NYMEX December natural gas traded at $4.40 per Mcf today.
Important disclosures: The information provided herein is believed to be reliable; however, EnerCom, Inc. makes no representation or warranty as to its completeness or accuracy. EnerCom’s conclusions are based upon information gathered from sources deemed to be reliable. This note is not intended as an offer or solicitation for the purchase or sale of any security or financial instrument of any company mentioned in this note. This note was prepared for general circulation and does not provide investment recommendations specific to individual investors. All readers of the note must make their own investment decisions based upon their specific investment objectives and financial situation utilizing their own financial advisors as they deem necessary. Investors should consider a company’s entire financial and operational structure in making any investment decisions. Past performance of any company discussed in this note should not be taken as an indication or guarantee of future results. EnerCom is a multi-disciplined management consulting services firm that regularly intends to seek business, or currently may be undertaking business, with companies covered on Oil & Gas 360®, and thereby seeks to receive compensation from these companies for its services. In addition, EnerCom, or its principals or employees, may have an economic interest in any of these companies. As a result, readers of EnerCom’s Oil & Gas 360® should be aware that the firm may have a conflict of interest that could affect the objectivity of this note. The company or companies covered in this note did not review the note prior to publication. EnerCom, or its principals or employees, may have an economic interest in any of the companies covered in this report or on Oil & Gas 360®. As a result, readers of EnerCom’s reports or Oil & Gas 360® should be aware that the firm may have a conflict of interest that could affect the objectivity of this report.
Analyst Commentary
KLR Group (11.19.14)
Analysis overview/construct
The economic analysis and NYMEX oil/gas price thresholds presented are based on E&P company capital performance derived from actual cash capital expenditures rather than company marketing presentations.
Our capital intensity computation reconciles actual cash capital outlays and production. Said another way, the cash capital cost to convert resource to production. Interestingly, the E&P industry’s capital intensity of ~$5.50/Mcfe (approximately $33/Boe) is ~$2.10/Mcfe (~$13/Boe) higher than the capital intensity implied in DD&A rates.
Cost of supply (cash breakeven): NYMEX $3.50-$4 gas/$70-$80 oil
Our analysis predicated on actual company capital performance brackets the cost of U.S. natural gas supply on the low end by Marcellus/Utica ($2.50-$3.50) and the high end by Fayetteville/Barnett ($4-$4.50).
The cost of U.S. oil supply is bracketed on the low end by the Eagle Ford/Permian Basin ($60-$70) and the high end by Mississippian/Uinta Basin (~$80).
Assuming a historically realistic 5% industry unleveraged return, the cost of U.S. natural gas supply is $4-$4.50 NYMEX, while the cost of U.S. oil supply is $90-$95 NYMEX.
Assuming a standard 10% unleveraged return, the cost of U.S. gas supply is $5-$5.50 NYMEX, while the cost of U.S. oil supply is $110-$115 NYMEX.


