The Energy Information Administration (EIA) released an updated geologic layout of the Eagle Ford Shale this morning, detailing the play’s thickness, footprint, elevation, and initial gas to oil ratios (GORs). The industry, as they do with all shale plays, continues to progress in unlocking the “code” of the Eagle Ford. The sprawling South Texas field has transformed from an emerging play to a region that single-handedly outproduces four OPEC countries on a monthly basis. The evolution of the shale can be seen in the EIA video below.
In the latest EIA report, the details are described as follows: “Deeper wells (up to 15,000 feet) to the southeast have higher initial GORs, or a relatively greater share of natural gas, while the shallower wells to the northwest (below 6,000 feet) have lower initial GORs, or a relatively greater share of oil. In the eastern half of the play, the wells that intersect the reservoir between 5,000 and 12,000 feet depth have initial GORs of 6000cf/bbl or less (producing more oil relative to gas). The western half of the play includes a wider depth distribution of wells, intersecting the formation from as deep as 14,000 feet to as shallow as 2,000 feet, and has initial GORs of 0to6000cf/bbl or higher (producing more gas relative to oil).”
Eagle Ford History
The Eagle Ford was producing miniscule amounts back in 2007, according to the EIA, and horizontal drilling was not utilized. Production jumped to an average of 29 MBOPD in 2010, exiting the year close to 60 MBOPD (roughly equal to current production from the Utica). Volume climbed to 182 MBOPD in April 2011.
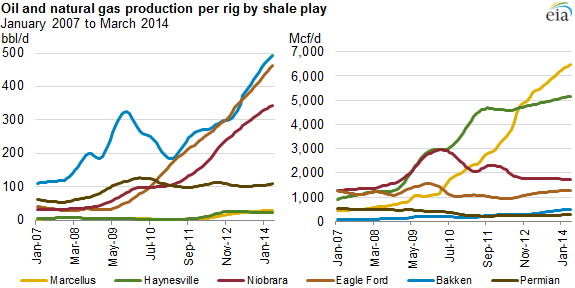
In 2012, the EIA reported new well starts for the first three months of the year more than doubled the amount from the prior year, and production levels continued to ascend. The projected average of 2012 was slated for 500 MBOPD, with more room to run if the oncoming wells were considered. Efficiency was also increasing, as evidenced by the graph below. On an oil basis, the Eagle Ford was the only play to register sequential growth since mid-2009. The EIA said, “Each drilling rig in the Eagle Ford Shale will contribute over 400 BOPD more in April 2014 than it would have in the same formation in January 2007.”
New production per rig in the latest Drilling Productivity Report is greater than 550 BOPD per rig, and the region’s volume is projected to reach 1,716 MBOPD in February 2015. The rig count has slipped slightly due to the recent commodity environment, but a January 8 note by Capital One Securities says the play still has the lowest break-even point ($53) of all major tight oil plays.
Mexico’s Prospects
The EIA’s report was truncated at the Mexico border for obvious reasons, but the updated Eagle Ford details only further prove the resource potential for our neighbors to the south. The problem, however, lies with political and technical factors.
The Mexico-United States border, particularly along the Eagle Ford trend, “is prone to lawlessness and drug cartel activity,” says a report from Reuters. A representative of Lewis Energy told the media in July that costs in onshore Mexico would be as much as 30% higher due to escalated security needs.
Mexico will also be able to “claim” most of its onshore projects, as part of its Round Zero process. In August, the Associated Press said: “It remains to be seen whether Mexico can assign complex contracts to private companies without the kind of kickbacks, favoritism and insider deals seen in the past,” but that “The law creates a national oil commission to take such decisions out of the hands of Pemex.”
The national oil company claimed 83% of all proved reserves in September. Only 21% of its possible reserves (mostly offshore) will stay in the hands of Mexico. The EIA believes the country holds roughly 117 billion BOE in resource potential (seventh most in the world). Mexico will certainly be seeking engineering expertise in the Eagle Ford, considering less than 20 shale wells have been drilled. For E&Ps, it boils down to the old, simple saying of “Is it worth the risk?”
Important disclosures: The information provided herein is believed to be reliable; however, EnerCom, Inc. makes no representation or warranty as to its completeness or accuracy. EnerCom’s conclusions are based upon information gathered from sources deemed to be reliable. This note is not intended as an offer or solicitation for the purchase or sale of any security or financial instrument of any company mentioned in this note. This note was prepared for general circulation and does not provide investment recommendations specific to individual investors. All readers of the note must make their own investment decisions based upon their specific investment objectives and financial situation utilizing their own financial advisors as they deem necessary. Investors should consider a company’s entire financial and operational structure in making any investment decisions. Past performance of any company discussed in this note should not be taken as an indication or guarantee of future results. EnerCom is a multi-disciplined management consulting services firm that regularly intends to seek business, or currently may be undertaking business, with companies covered on Oil & Gas 360®, and thereby seeks to receive compensation from these companies for its services. In addition, EnerCom, or its principals or employees, may have an economic interest in any of these companies. As a result, readers of EnerCom’s Oil & Gas 360® should be aware that the firm may have a conflict of interest that could affect the objectivity of this note. The company or companies covered in this note did not review the note prior to publication. EnerCom, or its principals or employees, may have an economic interest in any of the companies covered in this report or on Oil & Gas 360®. As a result, readers of EnerCom’s reports or Oil & Gas 360® should be aware that the firm may have a conflict of interest that could affect the objectivity of this report.