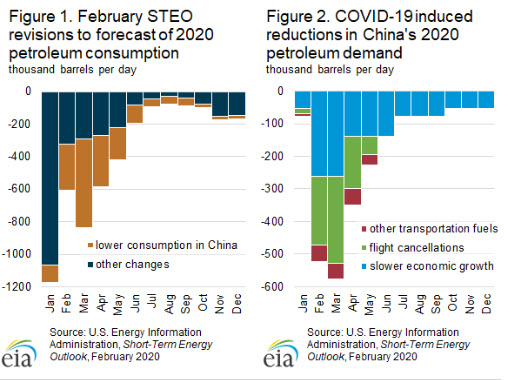
In the February 2020 update of its Short-Term Energy Outlook (STEO), the U.S. Energy Information Administration (EIA) forecasts that global liquid fuels demand will average 101.7 million barrels per day (b/d) in 2020, 1.0 million b/d more than the 2019 average. This latest estimate of 2020 global liquid fuels demand is 378,000 b/d less than was forecast in the January 2020 STEO (Figure 1). The difference between the forecasts is driven by a combination of lower-than-expected heating fuel consumption caused by the Northern Hemisphere’s warmer-than-expected winter, an expected slowing of economic growth in general, and the particular economic effects of the 2019 novel coronavirus (COVID-19) outbreak.
EIA estimates that COVID-19 will reduce China’s total petroleum and liquid fuels demand by an average of 190,000 b/d in 2020. This forecast is based on estimates of three separate components (Figure 2):
- The reduction in demand for petroleum and liquid fuels caused by the general decline in Chinese economic activity as measured by gross domestic product (GDP);
- The volume of foregone jet fuel consumption in China caused by flight cancellations; and
- The additional impact on China’s demand for other transportation fuels.
As with any forecast, EIA’s estimates contain a number of uncertainties and limitations. Notably, this forecast is particularly sensitive to the duration of the demand disruption caused by COVID-19. EIA assumes that the timing of COVID-19’s impact on petroleum demand will follow a similar path as the 2003 SARS coronavirus outbreak, with demand reductions that will intensify in February, peak in March, and steadily decline over April, May, and June. GDP-induced impacts will linger through December.
However, the 2003 SARS Coronavirus and COVID-19 have different rates of transmission, detection, and mortality. Consequently, EIA considered the example of the 2003 SARS coronavirus outbreak when estimating the duration and peak of the demand impacts, but did not consider it when estimating the levels of petroleum demand reductions. Based on estimates from Oxford Economics, economic growth in China is expected to rebound once COVID-19’s impact has faded, and EIA expects petroleum demand to approach the levels forecast in the January STEO near the end year.
[contextly_sidebar id=”YJphGCA0q96wsVENbTy74BYuNRIGgKdJ”]
The largest component of EIA’s estimate is the impact of COVID-19 on China’s economic activity and, by extension, on overall petroleum demand. Because China uses petroleum in a variety of sectors, including transportation, power generation, agriculture, and manufacturing, a slowdown in any one sector—let alone several simultaneously—can significantly affect China’s demand for petroleum fuels. To evaluate this dynamic, EIA used Oxford Economics’ recent projection that China’s annual GDP growth for 2020 will average 5.4%, down from its previous estimate of 6.0%. EIA input this lower GDP growth estimate into the equations that EIA uses to quantify the relationship between changes in economic activity and changes in oil consumption given historical trends. As a result, EIA estimates that declines in China’s economic activity will reduce China’s total petroleum demand by 115,000 b/d in 2020.
As indicated above, EIA disaggregated this annual average for lost demand into monthly averages by assuming that the pace of intensification and later decline follows a path similar to the 2003 SARS coronavirus outbreak. EIA assumes that declines in demand caused by slowing economic activity will peak in February and March at about 260,000 b/d, and then decline throughout the rest of 2020.
In EIA’s estimates, reduced jet fuel consumption is the second largest driver of the decline in China’s overall petroleum demand. EIA calculates its estimate of China’s foregone jet fuel consumption using daily data from publicly available flight trackers on cancelled flights. EIA identified about 12,000 cancelled flights leaving from airports in China, Hong Kong, Taiwan, and Macau that were scheduled to depart between January 12 and January 31. Using the longitude and latitude of each cancelled route’s origin and destination, EIA calculated the straight-line great-circle distance for each flight, to which a 10% increase was added to compensate for the 10% excess distance that airplanes fly on average relative to the shortest, perfectly optimized path. After factoring in the fuel efficiency of each cancelled flight’s assigned aircraft, EIA estimated the volume of jet fuel that would have been consumed had the flights occurred (Figure 3).
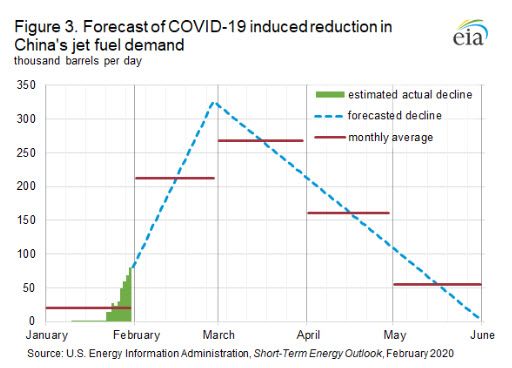
Using this methodology, EIA estimated that the cancellation of flights departing China in January would have consumed approximately 476,000 barrels of jet fuel over the month; cancellations on January 31 alone reached 93,000 b/d. EIA then extrapolated these daily volumes of foregone jet fuel consumption forward over the next several months using the path of the 2003 SARS coronavirus outbreak (Figure 3). EIA assumes that the daily volumes of China’s foregone jet fuel consumption caused by flight cancellations will increase at a linear rate until peaking on February 28 at about 330,000 b/d. According to data from the International Energy Agency, China consumed 860,000 b/d of jet fuel and kerosene in 2019, making this peak loss of 330,000 barrels in a single day equivalent to about 38% of China’s 2019 average daily jet fuel consumption. Following this peak loss, EIA projects that cancelled volumes will decline at a similarly linear, but slower, rate, until reaching zero in June. EIA estimates that China’s jet fuel consumption, aggregated at the annual level, will be 59,000 b/d lower during 2020 as a result of COVID-19.
The final component of EIA’s estimate is the impact of declines in petroleum consumption that are unlikely to be completely captured be either by the GDP-induced decline forecast or the flight cancellation-induced decline forecast. Consequently, this component is the smallest part of the overall COVID-19-induced decline in China’s petroleum demand in 2020, constituting about 16,000 b/d of the total 190,000 b/d reduction. This last category reflects the estimated impact of the temporary decisions made by the Chinese government to limit the travel of its citizens as it looks for ways to contain the spread of COVID-19. These decisions include measures that could directly affect transportation fuel consumption, such as road closures and quarantines in Wuhan and Hubei Province, as well as measures that could indirectly affect transportation fuel demand, such as onerous inspections along major roadways. Although decisions like these will likely have a material impact on GDP—and, therefore, potentially be double counted—the nature of these disruptions makes it likely they will have a disproportionate impact on petroleum demand that exceeds what might be predicted from the GDP impact alone. Given the fluid situation in China and the limited availability of official transportation statistics, EIA has not explicitly modeled this estimate, but created it with compiled anecdotal reports and the best estimates of EIA staff.
U.S. average regular gasoline and diesel prices decline
The U.S. average regular gasoline retail price decreased nearly 4 cents from the previous week to $2.42 per gallon on February 10, 14 cents higher than the same time last year. The Midwest price fell more than 5 cents to $2.26 per gallon, the Gulf Coast price fell nearly 5 cents to $2.09 per gallon, the East Coast price fell more than 2 cents to $2.37 per gallon, the Rocky Mountain price fell nearly 2 cents to $2.51 per gallon, and the West Coast price decreased 1 cent to $3.15 per gallon.
The U.S. average diesel fuel price fell nearly 5 cents from the previous week to $2.91 per gallon on February 10, 6 cents lower than a year ago. The Midwest price fell more than 6 cents to $2.78 per gallon, the Rocky Mountain price fell nearly 5 cents to $2.90 per gallon, the East Coast price fell more than 4 cents to $2.96 per gallon, and the Gulf Coast and West Coast prices each fell nearly 4 cents to $2.68 per gallon and $3.48 per gallon, respectively.
Residential heating fuel prices decrease
As of February 10, 2020, residential heating oil prices averaged more than $2.91 per gallon, more than 2 cents per gallon below last week’s price and nearly 27 cents per gallon lower than last year’s price at this time. Wholesale heating oil prices averaged almost $1.75 per gallon, more than 1 cent per gallon above last week’s price but more than 28 cents per gallon lower than a year ago.
Residential propane prices averaged almost $1.99 per gallon, less than 1 cent per gallon below last week’s price and nearly 45 cents per gallon less than a year ago. Wholesale propane prices averaged more than $0.55 per gallon, more than 3 cents per gallon lower than last week’s price and more than 22 cents per gallon below last year’s price.
Propane/propylene inventories decline
U.S. propane/propylene stocks decreased by 6.2 million barrels last week to 77.3 million barrels as of February 7, 2020, 17.9 million barrels (30.2%) greater than the five-year (2015-19) average inventory levels for this same time of year. Gulf Coast, East Coast, Midwest, and Rocky Mountain/West Coast inventories decreased by 4.3 million barrels, 0.9 million barrels, 0.8 million barrels, and 0.1 million barrels, respectively. Propylene non-fuel-use inventories represented 7.1% of total propane/propylene inventories.