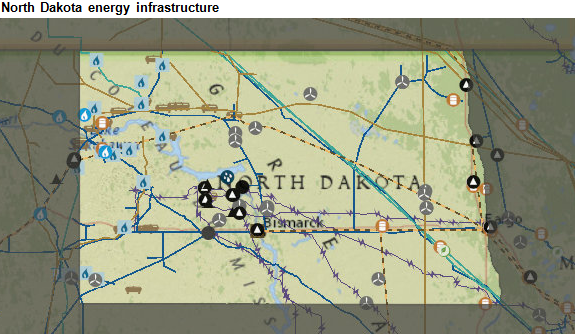
Views include oil and gas wells, pipelines, coal mines, power plants-oil, coal, nuclear, gas, transport terminals, market hubs, wind and solar capacity, administrative boundaries
The Energy Information Administration (EIA) has published a mapping tool that lets energy companies and analysts to look at the U.S. energy infrastructure through different lenses. These map layers can be presented over several base layers with geographic, topographic, street, or satellite image detail, as well as with state, county, and congressional district borders.
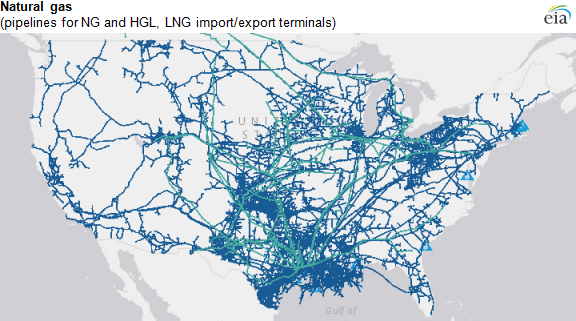
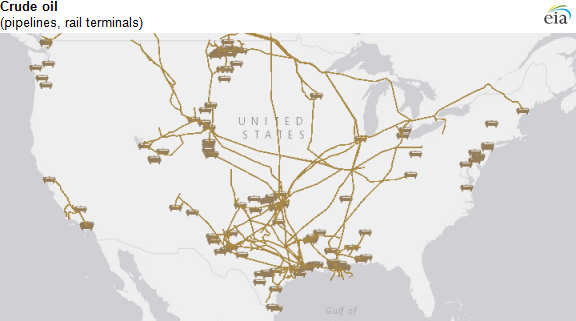
Basic overlays can include pipelines, power lines and storage throughout the U.S., but more in-depth options exist as well.
Each state’s map includes information from the EIA’s State Energy Data System, and viewers can select components of energy infrastructure in addition to parts of the energy system, such as locations of natural gas processing plants and wind power plants.
Under the “Layers/Legend” option in the upper right-hand portion of the map there is also a dropdown box that allows you to select predefined breakouts of infrastructure by energy source.
The EIA also has other mapping tools available, including its Energy Disruptions Map, which displays energy infrastructure along with current storm tracking information from NOAA, and its Flood Vulnerability Assessment Map, which combines energy infrastructure with flood hazard information from FEMA.
