A supplemental report to the U.S. Energy Information Administration’s (EIA) Annual Energy Outlook 2020 (AEO2020) describes two simple measures of cost and value that, when used together, largely explain the economic competitiveness of electricity generating technologies and, in turn, the types of power plants most likely to be built in EIA’s long-term model for the U.S. energy sector.
Cost: The levelized cost of electricity (LCOE) represents the installed capital costs and operating costs of a power plant, converted to a level stream of payments over the plant’s assumed financial lifetime. Installed capital costs include construction costs, financing costs, tax credits, and other plant-related subsidies or taxes. Operating costs include the cost of the fuel (for power plants that consume fuel), expected maintenance costs, and other related taxes or subsidies based on the operation of the plant.
Value: The levelized avoided cost of electricity (LACE) represents a power plant’s value to the grid. LACE is an estimate of a plant’s potential revenues from the sales of electricity generated from displacing another marginal asset. As with LCOE, these revenues are converted to a level stream of payments over the plant’s assumed financial lifetime.
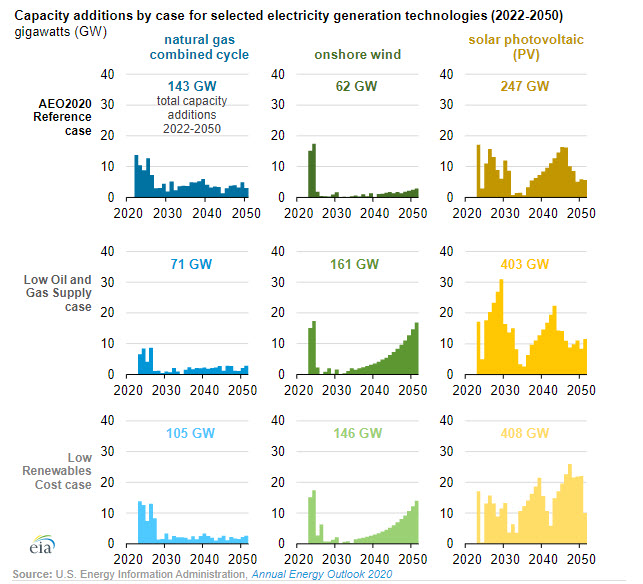
Two alternative cases to the AEO2020 Reference case illustrate how changing certain assumptions affect the LCOEs, LACEs, and value-cost ratios of generating technologies. In the Low Oil and Gas Supply case, EIA assumes less U.S. oil and natural gas resource availability, resulting in less production at higher prices than in the Reference case. In this case, high natural gas prices affect the marginal cost of electricity generation. In the Low Renewables Cost case, EIA assumes that the overnight capital and fixed operations and maintenance costs decline at a faster pace than in the Reference case, ultimately ending up 40% lower than in the Reference case by 2050.
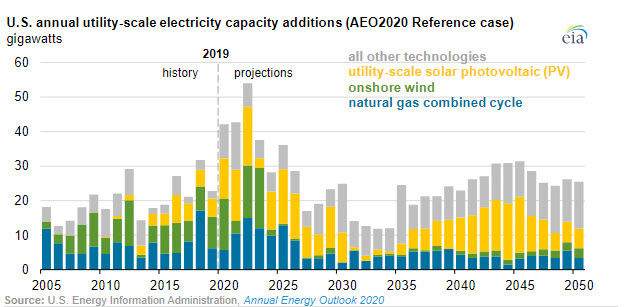
Between 2022 and 2050, most of the modeled capacity additions come from three technologies: solar photovoltaic (PV), onshore wind, and natural gas combined cycle (CC). Cost and value metrics for modeled capacity additions are shown starting in 2022 because that is the first feasible year that all three technologies are available to come online, given assumed construction lead time and licensing requirements.
In the Reference case, these three technologies collectively account for 63% of all projected utility-scale capacity additions from 2022 through 2050. In the other two cases, renewables capacity additions are almost at the same level by 2050, but natural gas-fired capacity additions differ.
LCOE changes over time as a result of changing market factors:
- Natural gas CC’s LCOE increases over time because of the rising natural gas prices that, in turn, increase operating costs. In the Low Oil and Gas Supply case, natural gas CC’s LCOE increase faster than in the Reference case.
- Onshore wind’s and solar PV’s LCOEs increase from 2022 to 2025 as tax credits expire but then decrease because of declining capital costs. In the Low Renewables Cost case, these technologies’ LCOEs decline even faster.
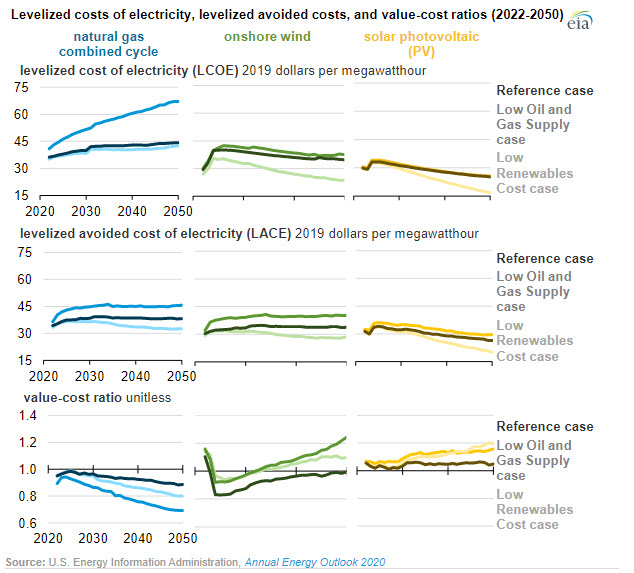
LACE values are affected by wholesale electricity prices. Natural gas CC units are generally considered to be the marginal source of electricity generation, meaning the cost of electricity generated from that technology is most often setting the electricity price. As natural gas prices increase, the marginal source becomes more expensive to operate, and the value to the grid of avoiding this cost by building new capacity increases.
- Natural gas CC’s and wind’s LACEs follow the general trend of natural gas prices, which are higher in the Low Oil and Gas Supply case. In the Low Renewables Cost case, more electricity generation from renewable sources with zero fuel costs lowers wholesale electricity prices.
- Solar PV’s LACE declines in all three cases because the market becomes saturated with zero-fuel-cost generators that are operating during the same daylight hours in a given market.
The ratio of LACE to LCOE serves as a value-to-cost ratio. Power plants are considered economically attractive when their projected value (LACE) exceeds their projected cost (LCOE), meaning their value-cost ratio exceeds one.
- Natural gas CC’s value-cost ratio stays close to 1.0 until the end of the projection period. Natural gas CC’s value-cost ratio is even lower in the Low Oil and Gas Supply case, suggesting that natural gas CC is not economically attractive with higher natural gas prices.
- Even though solar PV’s and wind’s LACEs decline over time, their LCOEs decline much faster, making them both more economically attractive in the long term. These technologies also have favorable value-to-cost ratios in the near term when tax credits are available.
More information about LCOE, LACE, and the economic competitiveness of electricity generating technologies in the AEO2020 Reference case is available in EIA’s Levelized Cost and Levelized Avoided Cost of New Generation Resources in the Annual Energy Outlook 2020 report.