Enable Midstream Announces Fourth Quarter and Full-Year 2019 Financial and Operating Results
-
Achieved record high annual natural gas gathered, natural gas processed, natural gas transported, and crude oil and condensate gathered volumes
-
Enable Mississippi River Transmission, LLC (MRT) has agreed to rate case settlement terms with all of MRT’s firm capacity customers that participated in the pipeline’s recent rate cases
-
Contracted or extended over 1,220,000 dekatherms per day (Dth/d) of transportation capacity during fourth quarter 2019, including contracts associated with the MRT rate cases that are subject to Federal Energy Regulatory Commission (FERC) approval
Enable Midstream Partners, LP (NYSE: ENBL) today announced financial and operating results for fourth quarter and full-year 2019.
Net income attributable to limited partners was $18 million for fourth quarter 2019, a decrease of $156 million compared to $174 million for fourth quarter 2018. Net income attributable to common units was $9 million for fourth quarter 2019, a decrease of $156 million compared to $165 million for fourth quarter 2018. Net cash provided by operating activities was $251 million for fourth quarter 2019, a decrease of $35 million compared to $286 million for fourth quarter 2018. Adjusted EBITDA was $274 million for fourth quarter 2019, an increase of $3 million compared to $271 million for fourth quarter 2018. Distributable cash flow (DCF) was $177 million for fourth quarter 2019, an increase of $4 million compared to $173 million for fourth quarter 2018.
Net income attributable to limited partners was $396 million for full-year 2019, a decrease of $125 million compared to $521 million for full-year 2018. Net income attributable to common units was $360 million for full-year 2019, a decrease of $125 million compared to $485 million for full-year 2018. Net cash provided by operating activities was $942 million for full-year 2019, an increase of $18 million compared to $924 million for full-year 2018. Adjusted EBITDA for full-year 2019 was $1,147 million, an increase of $73 million compared to $1,074 million for full-year 2018. DCF for full-year 2019 was $784 million, an increase of $24 million compared to $760 million for full-year 2018.
Enable’s net income for fourth quarter and full-year 2019 was impacted by a non-cash goodwill impairment charge of $86 million associated with the Anadarko Basin reporting unit in the gathering and processing segment. The impairment was driven by a decrease in forecast cash flows as a result of lower forward commodity prices and a reduction in expected producer activity and an increase in the partnership’s weighted average cost of capital.
Enable uses derivatives to manage commodity price risk, and the gain or loss associated with these derivatives is recognized in earnings. Enable’s net income attributable to limited partners and net income attributable to common units for fourth quarter 2019 included a $2 million gain on commodity derivative activity, compared to a $49 million gain on commodity derivative activity for fourth quarter 2018, resulting in a decrease in net income of $47 million. The decrease of $47 million is comprised of a decrease related to the change in fair value of commodity derivatives of $62 million and an increase in realized gain on commodity derivatives of $15 million. Enable’s net income attributable to limited partners and net income attributable to common units for full-year 2019 included a $16 million gain on commodity derivative activity, compared to an $11 million gain on commodity derivative activity for full-year 2018, resulting in an increase in net income of $5 million. The increase of $5 million is comprised of an increase in realized gain on commodity derivatives of $42 million, partially offset by a decrease related to the change in fair value of commodity derivatives of $37 million.
For fourth quarter 2019, DCF exceeded declared distributions to common unitholders by $33 million, resulting in a distribution coverage ratio of 1.23x. For full-year 2019, DCF exceeded declared distributions to common unitholders by $214 million, resulting in a distribution coverage ratio of 1.38x.
For additional information regarding the non-GAAP financial measures Gross margin, Adjusted EBITDA, DCF, Adjusted interest expense and distribution coverage ratio, please see “Non-GAAP Financial Measures.”
MANAGEMENT PERSPECTIVE
“The energy industry experienced significant changes in 2019, and Enable rose to the challenge as we set records for annual gathering, processing and transportation volumes,” said Rod Sailor, president and CEO. “As we face the headwinds of 2020, Enable remains focused on operational excellence, cost discipline and efficient capital deployment.”
BUSINESS HIGHLIGHTS
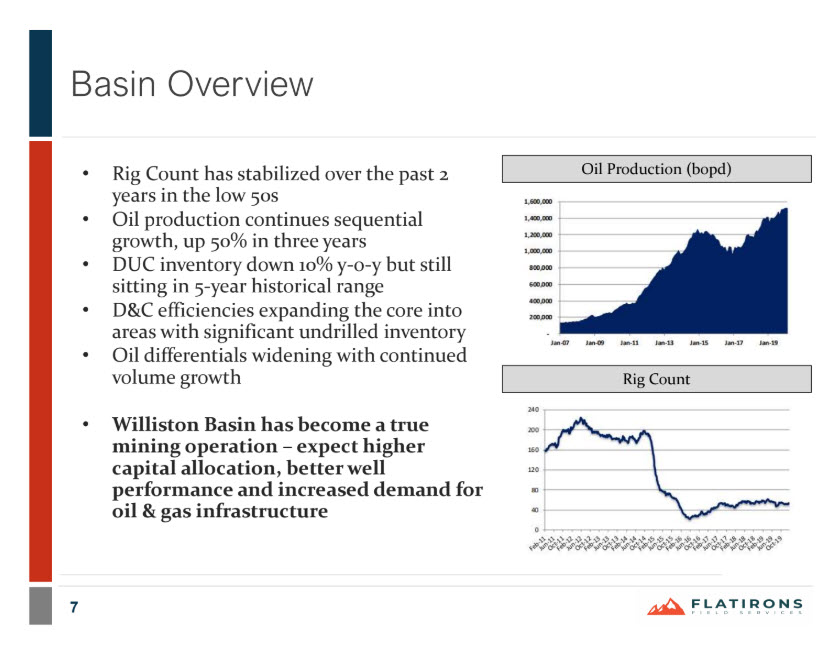
As of Feb. 10, 2020, there were twenty-seven rigs across Enable’s footprint that were drilling wells expected to be connected to Enable’s gathering systems. Nineteen of those rigs were in the Anadarko Basin, five were in the Ark-La-Tex Basin and three were in the Williston Basin. Enable’s Anadarko Basin crude and condensate midstream platform achieved gathered volumes of over 122 thousand barrels per day (MBbl/d) during fourth quarter 2019, and Enable expects to gather crude or condensate from wells drilled by 50 percent of the rigs currently active on Enable’s gathering footprint in the SCOOP play.
During fourth quarter 2019, Enable contracted or extended over 1,220,000 Dth/d of natural gas transportation capacity, including contracts associated with the MRT rate cases that are subject to FERC approval. Enable Gas Transmission, LLC (EGT) has seen a continued increase in activity on its Line CP segment, and in the fourth quarter, EGT contracted or extended over 235,000 Dth/d of firm transportation service on Line CP. On the MRT system, MRT signed over 570,000 Dth/d of long-term agreements in the fourth quarter related to the MRT rate cases, which are subject to FERC approval and include agreements with affiliates of Spire Inc. Enable’s contracting efforts have extended the firm transportation volume-weighted-average remaining contract life for EGT, MRT and Enable Oklahoma Interstate Transmission, LLC (EOIT) from 3.6 years at year-end 2018 to 4.1 years at year-end 2019.
MRT has agreed to rate case settlement terms with all of MRT’s firm capacity customers that participated in the pipeline’s recent rate cases, with 90 percent of third-party transportation capacity now extended into 2024. MRT expects FERC to rule on the proposed settlements in the first half of 2020, and the pipeline’s new recourse rates and newly negotiated rate agreements will become effective upon FERC approval. Upon approval of the settlements, MRT will make any necessary refunds to customers and recognize as income any amounts that have been reserved but not refunded for periods prior to the effective date of the FERC approval. Assuming the settlements are approved in 2020, MRT expects revenues for 2020 to be higher than the revenues MRT recognized in 2018, which were unaffected for the rate case or capacity turnbacks.
Enable expects to file certificate applications with FERC by the end of first quarter 2020 seeking authorization for the Gulf Run Pipeline project. The project scope expected to be filed in the applications would provide approximately 1.7 billion cubic feet per day (Bcf/d) of capacity, which would both accommodate Golden Pass’s 1.1 Bcf/d commitment and allow for additional capacity subscriptions that may develop from ongoing discussions, at an estimated total cost for the filed scope of approximately $640 million, excluding costs related to allowance for funds used during construction. The project will be appropriately sized to meet contracted customer capacity commitments and is expected to be placed into service in late 2022, subject to FERC approval.
QUARTERLY DISTRIBUTIONS
As previously announced, on Feb. 7, 2020, the board of directors of Enable’s general partner declared a quarterly cash distribution of $0.3305 per unit on all outstanding common units for the quarter ended Dec. 31, 2019, an increase of approximately 4 percent when compared to fourth quarter 2018. The quarterly cash distribution of $0.3305 per unit on all outstanding common units will be paid Feb. 25, 2020, to unitholders of record at the close of business Feb. 18, 2020.
Also as previously announced, the board declared a quarterly cash distribution of $0.625 per unit on all outstanding Series A Preferred Units for the quarter ended Dec. 31, 2019. The quarterly cash distribution of $0.625 per unit on all outstanding Series A Preferred Units was paid Feb. 14, 2020, to unitholders of record at the close of business Feb. 7, 2020.
KEY OPERATING STATISTICS
Natural gas gathered volumes were 4.62 trillion British thermal units per day (TBtu/d) for fourth quarter 2019, which remained flat compared to fourth quarter 2018. This was primarily driven by higher gathered volumes in the Anadarko and Ark-La-Tex Basins, offset by lower gathered volumes in the Arkoma Basin.
Natural gas processed volumes were 2.57 TBtu/d for fourth quarter 2019, which remained flat compared to fourth quarter 2018. This was primarily driven by higher processed volumes in the Anadarko Basin, offset by lower processed volumes in the Ark-La-Tex and Arkoma Basins.
Crude oil and condensate gathered volumes were 153.06 MBbl/d for fourth quarter 2019, an increase of 76.47 MBbl/d compared to 76.59 MBbl/d for fourth quarter 2018. The increase was primarily due to the November 2018 acquisition of Enable Oklahoma Crude Services, LLC’s (EOCS) crude oil and condensate gathering system in the Anadarko Basin and an 8 percent increase in crude oil gathered volumes in the Williston Basin.
Transported volumes were 5.99 Tbtu/d for fourth quarter 2019, an increase of 0.27 Tbtu/d compared to 5.72 Tbtu/d for fourth quarter 2018. The increase was primarily due to newly contracted capacity on EGT.
Interstate transportation firm contracted capacity was 6.30 Bcf/d for fourth quarter 2019, an increase of 1 percent compared to 6.24 Bcf/d for fourth quarter 2018. The increase was primarily due to newly contracted capacity on EGT’s Line CP.
Intrastate transportation average deliveries were 2.09 TBtu/d for fourth quarter 2019, a decrease of 5 percent compared to 2.21 TBtu/d for fourth quarter 2018. The decrease was primarily related to lower interruptible transportation, partially offset by increased power plant utilization.
FOURTH QUARTER FINANCIAL PERFORMANCE
Revenues were $731 million for fourth quarter 2019, a decrease of $219 million compared to $950 million for fourth quarter 2018. Revenues are net of $84 million of intercompany eliminations for fourth quarter 2019 and $183 million of intercompany eliminations for fourth quarter 2018.
Gathering and processing segment revenues were $579 million for fourth quarter 2019, a decrease of $229 million compared to $808 million for fourth quarter 2018. The decrease in gathering and processing segment revenues was primarily due to:
-
a decrease in revenues from natural gas sales due to lower average realized natural gas sales prices and lower sales volumes as well as a decrease in revenues from natural gas liquids (NGLs) sales primarily due to a decrease in the average realized sales price from lower average market prices for all NGL products, lower processed volumes in the Ark-La-Tex and Arkoma Basins and higher volumes subject to fee deductions for NGLs sold under certain third-party processing arrangements, partially offset by higher processed volumes in the Anadarko Basin,
-
a decrease in changes in the fair value of natural gas, condensate and NGL derivatives and
-
a decrease in processing service revenues due to lower processed volumes in the Ark-La-Tex and Arkoma Basins, partially offset by higher processed volumes in the Anadarko Basin.
These decreases were partially offset by:
-
an increase in natural gas gathering revenues due to higher fees and gathered volumes in the Anadarko and Ark-La-Tex Basins and higher revenue associated with the amendment of certain minimum volume commitment contracts in the Arkoma Basin, partially offset by lower gathered volumes in the Arkoma Basin and lower shortfall payments associated with the expiration of certain minimum volume commitment contracts in the Arkoma Basin,
-
an increase in revenues from crude oil, condensate and produced water gathering revenues primarily due to an increase related to the November 2018 acquisition of EOCS and an increase in volumes in the Williston Basin, partially offset by lower average gathering rates in the Williston Basin and
-
an increase in realized gains on natural gas, condensate and NGL derivatives.
Transportation and storage segment revenues were $236 million for fourth quarter 2019, a decrease of $89 million compared to $325 million for fourth quarter 2018. The decrease in transportation and storage segment revenues was primarily due to a decrease in revenues from natural gas sales primarily due to lower sales volumes and lower average sales price. This decrease was partially offset by an increase in realized gains on natural gas derivatives.
Gross margin was $410 million for fourth quarter 2019, a decrease of $56 million compared to $466 million for fourth quarter 2018.
Gathering and processing segment gross margin was $271 million for fourth quarter 2019, a decrease of $58 million compared to $329 million for fourth quarter 2018. The decrease in gathering and processing segment gross margin was primarily due to:
-
a decrease in changes in the fair value of natural gas, condensate and NGL derivatives,
-
a decrease in revenues from NGL sales due to lower average sales prices for all NGL products and lower processed volumes in the Ark-La-Tex and Arkoma Basins, partially offset by higher processed volumes in the Anadarko Basin and
-
a decrease in revenues from natural gas due to lower average natural gas sales prices and lower sales volumes.
These decreases were partially offset by:
-
an increase in natural gas gathering fees due to higher fees and gathered volumes in the Anadarko and Ark-La-Tex Basins and higher revenue associated with the amendment of certain minimum volume commitment contracts in the Arkoma Basin, partially offset by lower gathered volumes in the Arkoma Basin and lower shortfall payments associated with the expiration of certain minimum volume commitment contracts in the Arkoma Basin,
-
an increase in realized gains on natural gas, condensate and NGL derivatives and
-
an increase in crude, condensate and produced water gathering revenues primarily due to an increase related to the November 2018 acquisition of EOCS and an increase in volumes in the Williston Basin, partially offset by lower average gathering rates in the Williston Basin.
Transportation and storage segment gross margin was $139 million for fourth quarter 2019, an increase of $4 million compared to $135 million for fourth quarter 2018. The increase in transportation and storage segment gross margin was primarily due to an increase in system management activities. This increase was partially offset by a decrease in firm transportation and storage services.
Operation and maintenance and general and administrative expenses were $137 million for fourth quarter 2019, an increase of $6 million compared to $131 million for fourth quarter 2018. The increase in operation and maintenance and general and administrative expenses was primarily due to an increase in payroll-related costs, an increase in outside services due to pipeline safety and storage integrity work under Enable’s pipeline safety program and to comply with certain Pipeline and Hazardous Materials Safety Administration regulations and a $4 million loss on retirement of assets during 2019 with no comparable item in 2018. These increases were partially offset by a decrease in acquisition-related costs occurring in fourth quarter 2018 with no comparable item in fourth quarter 2019.
Depreciation and amortization expense was $110 million for fourth quarter 2019, an increase of $4 million compared to $106 million for fourth quarter 2018. The increase in depreciation and amortization expense was primarily due to the amortization of customer intangibles acquired as part of the November 2018 acquisition of EOCS, other additional assets placed in service and an increase in depreciation from the implementation of new rates for gathering and processing assets from a new depreciation study, partially offset by a decrease in depreciation from the implementation of new intrastate natural gas pipeline rates from a new depreciation study.
Taxes other than income tax were $15 million for fourth quarter 2019, a decrease of $2 million compared to $17 million for fourth quarter 2018. The decrease was primarily due to favorable tax settlements.
Interest expense was $48 million for fourth quarter 2019, an increase of $5 million compared to $43 million for fourth quarter 2018. The increase was primarily due to an increase in the amount of and interest rates on outstanding debt.
Capital expenditures were $79 million for fourth quarter 2019, compared to $620 million for fourth quarter 2018. Expansion capital expenditures were $39 million for fourth quarter 2019, compared to $576 million for fourth quarter 2018. Maintenance capital expenditures were $40 million for fourth quarter 2019, compared to $44 million for fourth quarter 2018.
2020 OUTLOOK
Enable reaffirms the 2020 financial outlook, including expansion capital outlook, presented in its third quarter 2019 financial results press release dated Nov. 6, 2019.
EARNINGS CONFERENCE CALL AND WEBCAST
A conference call discussing fourth quarter results is scheduled today at 10 a.m. EST (9 a.m. CST). The toll-free dial-in number to access the conference call is 833-535-2200, and the international dial-in number is 412-902-6730. The conference call ID is Enable Midstream Partners. Investors may also listen to the call via Enable’s website at https://investors.enablemidstream.com. Replays of the conference call will be available on Enable’s website.
ANNUAL REPORT
Enable today filed its annual report on the Form 10-K with the U.S. Securities and Exchange Commission (SEC).
The Form 10-K is available to view, print or download from the SEC filings page under the Investor Relations section on the Enable Midstream website at https://investors.enablemidstream.com.
Unitholders may order a printed copy of the Form 10-K by contacting Enable Midstream Investor Relations at 405-558-4600 or ir@enablemidstream.com.
AVAILABLE INFORMATION
Enable files annual, quarterly and other reports and other information with the SEC. Enable’s SEC filings are also available at the SEC’s website at https://www.sec.gov which contains information regarding issuers that file electronically with the SEC. Information about Enable may also be obtained at the offices of the NYSE, 20 Broad Street, New York, New York 10005, or on Enable’s website at https://www.enablemidstream.com. On the Investor Relations section of Enable’s website, https://investors.enablemidstream.com, Enable makes available free of charge a variety of information to investors. Enable’s goal is to maintain the Investor Relations section of its website as a portal through which investors can easily find or navigate to pertinent information about Enable, including but not limited to:
-
Enable’s annual reports on Form 10-K, quarterly reports on Form 10-Q, current reports on Form 8-K and any amendments to those reports as soon as reasonably practicable after Enable electronically files that material with or furnishes it to the SEC;
-
press releases on quarterly distributions, quarterly earnings and other developments;
-
governance information, including Enable’s governance guidelines, committee charters and code of ethics and business conduct;
-
information on events and presentations, including an archive of available calls, webcasts and presentations;
-
news and other announcements that Enable may post from time to time that investors may find useful or interesting; and
-
opportunities to sign up for email alerts and RSS feeds to have information pushed in real time.
ABOUT ENABLE MIDSTREAM PARTNERS
Enable owns, operates and develops strategically located natural gas and crude oil infrastructure assets. Enable’s assets include approximately 14,000 miles of natural gas, crude oil, condensate and produced water gathering pipelines, approximately 2.6 Bcf/d of natural gas processing capacity, approximately 7,800 miles of interstate pipelines (including Southeast Supply Header, LLC of which Enable owns 50 percent), approximately 2,300 miles of intrastate pipelines and eight natural gas storage facilities comprising 84.5 billion cubic feet of storage capacity. For more information, visit https://www.enablemidstream.com.
This release is intended to be a qualified notice under Treasury Regulation Section 1.1446-4(b). Brokers and nominees should treat one hundred percent (100.0%) of Enable’s distributions to foreign investors as being attributable to income that is effectively connected with a United States trade or business. Accordingly, Enable’s distributions to foreign investors are subject to federal income tax withholding at the highest applicable effective tax rate. Brokers and nominees, and not Enable, are treated as the withholding agents responsible for withholding on the distributions received by them on behalf of foreign investors.
NON-GAAP FINANCIAL MEASURES
Enable has included the non-GAAP financial measures Gross margin, Adjusted EBITDA, DCF, Adjusted interest expense and distribution coverage ratio in this press release based on information in its consolidated financial statements.
Gross margin, Adjusted EBITDA, DCF, Adjusted interest expense and distribution coverage ratio are supplemental financial measures that management and external users of Enable’s financial statements, such as industry analysts, investors, lenders and rating agencies may use, to assess:
-
Enable’s operating performance as compared to those of other publicly traded partnerships in the midstream energy industry, without regard to capital structure or historical cost basis;
-
The ability of Enable’s assets to generate sufficient cash flow to make distributions to its partners;
-
Enable’s ability to incur and service debt and fund capital expenditures; and
-
The viability of acquisitions and other capital expenditure projects and the returns on investment of various investment opportunities.
This press release includes a reconciliation of Gross margin to total revenues, Adjusted EBITDA and DCF to net income attributable to limited partners, Adjusted EBITDA to net cash provided by operating activities and Adjusted interest expense to interest expense, the most directly comparable GAAP financial measures as applicable, for each of the periods indicated. Distribution coverage ratio is a financial performance measure used by management to reflect the relationship between Enable’s financial operating performance and cash distributions. Enable believes that the presentation of Gross margin, Adjusted EBITDA, DCF, Adjusted interest expense and distribution coverage ratio provides information useful to investors in assessing its financial condition and results of operations. Gross margin, Adjusted EBITDA, DCF, Adjusted interest expense and distribution coverage ratio should not be considered as alternatives to net income, operating income, total revenue, cash flow from operating activities or any other measure of financial performance or liquidity presented in accordance with GAAP. Gross margin, Adjusted EBITDA, DCF, Adjusted interest expense, and distribution coverage ratio have important limitations as analytical tools because they exclude some but not all items that affect the most directly comparable GAAP measures. Additionally, because Gross margin, Adjusted EBITDA, DCF, Adjusted interest expense and distribution coverage ratio may be defined differently by other companies in Enable’s industry, its definitions of these measures may not be comparable to similarly titled measures of other companies, thereby diminishing their utility.
FORWARD-LOOKING STATEMENTS
Some of the information in this press release may contain forward-looking statements. Forward-looking statements give our current expectations, contain projections of results of operations or of financial condition, or forecasts of future events. Words such as “could,” “will,” “should,” “may,” “assume,” “forecast,” “position,” “predict,” “strategy,” “expect,” “intend,” “plan,” “estimate,” “anticipate,” “believe,” “project,” “budget,” “potential,” or “continue,” and similar expressions are used to identify forward-looking statements. Without limiting the generality of the foregoing, forward-looking statements contained in this press release include our expectations of plans, strategies, objectives, growth and anticipated financial and operational performance, including revenue projections, capital expenditures and tax position. Forward-looking statements can be affected by assumptions used or by known or unknown risks or uncertainties. Consequently, no forward-looking statements can be guaranteed.
A forward-looking statement may include a statement of the assumptions or bases underlying the forward-looking statement. We believe that we have chosen these assumptions or bases in good faith and that they are reasonable. However, when considering these forward-looking statements, you should keep in mind the risk factors and other cautionary statements in this press release and in our Annual Report on Form 10-K for the year ended Dec. 31, 2019 (“Annual Report”). Those risk factors and other factors noted throughout this press release and in our Annual Report could cause our actual results to differ materially from those disclosed in any forward-looking statement. You are cautioned not to place undue reliance on any forward-looking statements.
Any forward-looking statements speak only as of the date on which such statement is made and we undertake no obligation to correct or update any forward-looking statement, whether as a result of new information or otherwise, except as required by applicable law.
|
|
|
|
ENABLE MIDSTREAM PARTNERS, LP
CONSOLIDATED STATEMENTS OF INCOME
(Unaudited)
|
|
|
|
|
|
Three Months Ended
December 31,
|
|
Year Ended
December 31,
|
|
2019
|
|
2018
|
|
2019
|
|
2018
|
|
|
|
|
|
|
|
|
|
(In millions, except per unit data)
|
Revenues (including revenues from affiliates):
|
|
|
|
|
|
|
|
Product sales
|
$
|
377
|
|
|
$
|
609
|
|
|
$
|
1,533
|
|
|
$
|
2,106
|
|
Service revenue
|
354
|
|
|
341
|
|
|
1,427
|
|
|
1,325
|
|
Total Revenues
|
731
|
|
|
950
|
|
|
2,960
|
|
|
3,431
|
|
Cost and Expenses (including expenses from affiliates):
|
|
|
|
|
|
|
|
Cost of natural gas and natural gas liquids (excluding depreciation and amortization shown separately)
|
321
|
|
|
484
|
|
|
1,279
|
|
|
1,819
|
|
Operation and maintenance
|
116
|
|
|
99
|
|
|
423
|
|
|
388
|
|
General and administrative
|
21
|
|
|
32
|
|
|
103
|
|
|
113
|
|
Depreciation and amortization
|
110
|
|
|
106
|
|
|
433
|
|
|
398
|
|
Impairment
|
86
|
|
|
—
|
|
|
86
|
|
|
—
|
|
Taxes other than income tax
|
15
|
|
|
17
|
|
|
67
|
|
|
65
|
|
Total Cost and Expenses
|
669
|
|
|
738
|
|
|
2,391
|
|
|
2,783
|
|
Operating Income
|
62
|
|
|
212
|
|
|
569
|
|
|
648
|
|
Other Income (Expense):
|
|
|
|
|
|
|
|
Interest expense
|
(48
|
)
|
|
(43
|
)
|
|
(190
|
)
|
|
(152
|
)
|
Equity in earnings of equity method affiliate
|
5
|
|
|
6
|
|
|
17
|
|
|
26
|
|
Other, net
|
1
|
|
|
(1
|
)
|
|
3
|
|
|
—
|
|
Total Other Expense
|
(42
|
)
|
|
(38
|
)
|
|
(170
|
)
|
|
(126
|
)
|
Income Before Income Tax
|
20
|
|
|
174
|
|
|
399
|
|
|
522
|
|
Income tax benefit
|
—
|
|
|
(1
|
)
|
|
(1
|
)
|
|
(1
|
)
|
Net Income
|
$
|
20
|
|
|
$
|
175
|
|
|
$
|
400
|
|
|
$
|
523
|
|
Less: Net income attributable to noncontrolling interest
|
2
|
|
|
1
|
|
|
4
|
|
|
2
|
|
Net Income Attributable to Limited Partners
|
$
|
18
|
|
|
$
|
174
|
|
|
$
|
396
|
|
|
$
|
521
|
|
Less: Series A Preferred Unit distributions
|
9
|
|
|
9
|
|
|
36
|
|
|
36
|
|
Net Income Attributable to Common Units
|
$
|
9
|
|
|
$
|
165
|
|
|
$
|
360
|
|
|
$
|
485
|
|
|
|
|
|
|
|
|
|
Basic earnings per unit
|
|
|
|
|
|
|
|
Common units
|
$
|
0.02
|
|
|
$
|
0.38
|
|
|
$
|
0.83
|
|
|
$
|
1.12
|
|
Diluted earnings per unit
|
|
|
|
|
|
|
|
Common units
|
$
|
0.02
|
|
|
$
|
0.38
|
|
|
$
|
0.82
|
|
|
$
|
1.11
|
|
|
|
|
|
ENABLE MIDSTREAM PARTNERS, LP
RECONCILIATION OF NON-GAAP FINANCIAL MEASURES
|
|
|
|
|
|
Three Months Ended
December 31,
|
|
Year Ended
December 31,
|
|
2019
|
|
2018
|
|
2019
|
|
2018
|
|
|
|
|
|
|
|
|
|
(In millions)
|
Reconciliation of Gross margin to Total Revenues:
|
|
|
|
|
|
|
|
Consolidated
|
|
|
|
|
|
|
|
Product sales
|
$
|
377
|
|
|
$
|
609
|
|
|
$
|
1,533
|
|
|
$
|
2,106
|
|
Service revenue
|
354
|
|
|
341
|
|
|
1,427
|
|
|
1,325
|
|
Total Revenues
|
731
|
|
|
950
|
|
|
2,960
|
|
|
3,431
|
|
Cost of natural gas and natural gas liquids (excluding depreciation and amortization)
|
321
|
|
|
484
|
|
|
1,279
|
|
|
1,819
|
|
Gross margin
|
$
|
410
|
|
|
$
|
466
|
|
|
$
|
1,681
|
|
|
$
|
1,612
|
|
|
|
|
|
|
|
|
|
Reportable Segments
|
|
|
|
|
|
|
|
Gathering and Processing
|
|
|
|
|
|
|
|
Product sales
|
$
|
353
|
|
|
$
|
605
|
|
|
$
|
1,449
|
|
|
$
|
2,016
|
|
Service revenue
|
226
|
|
|
203
|
|
|
889
|
|
|
802
|
|
Total Revenues
|
579
|
|
|
808
|
|
|
2,338
|
|
|
2,818
|
|
Cost of natural gas and natural gas liquids (excluding depreciation and amortization)
|
308
|
|
|
479
|
|
|
1,203
|
|
|
1,741
|
|
Gross margin
|
$
|
271
|
|
|
$
|
329
|
|
|
$
|
1,135
|
|
|
$
|
1,077
|
|
|
|
|
|
|
|
|
|
Transportation and Storage
|
|
|
|
|
|
|
|
Product sales
|
$
|
106
|
|
|
$
|
183
|
|
|
$
|
487
|
|
|
$
|
625
|
|
Service revenue
|
130
|
|
|
142
|
|
|
551
|
|
|
537
|
|
Total Revenues
|
236
|
|
|
325
|
|
|
1,038
|
|
|
1,162
|
|
Cost of natural gas and natural gas liquids (excluding depreciation and amortization)
|
97
|
|
|
190
|
|
|
491
|
|
|
628
|
|
Gross margin
|
$
|
139
|
|
|
$
|
135
|
|
|
$
|
547
|
|
|
$
|
534
|
|
|
Three Months Ended
December 31,
|
|
Year Ended
December 31,
|
|
2019
|
|
2018
|
|
2019
|
|
2018
|
|
|
|
|
|
|
|
|
|
(In millions, except Distribution coverage ratio)
|
Reconciliation of Adjusted EBITDA and DCF to net income attributable to limited partners and calculation of Distribution coverage ratio:
|
|
|
|
|
|
|
|
Net income attributable to limited partners
|
$
|
18
|
|
|
$
|
174
|
|
|
$
|
396
|
|
|
$
|
521
|
|
Depreciation and amortization expense
|
110
|
|
|
106
|
|
|
433
|
|
|
398
|
|
Interest expense, net of interest income
|
47
|
|
|
43
|
|
|
188
|
|
|
152
|
|
Income tax benefit
|
—
|
|
|
(1
|
)
|
|
(1
|
)
|
|
(1
|
)
|
Distributions received from equity method affiliate in excess of equity earnings
|
—
|
|
|
(4
|
)
|
|
8
|
|
|
7
|
|
Non-cash equity-based compensation
|
3
|
|
|
4
|
|
|
16
|
|
|
16
|
|
Change in fair value of derivatives (1)
|
8
|
|
|
(54
|
)
|
|
11
|
|
|
(26
|
)
|
Other non-cash losses (2)
|
3
|
|
|
3
|
|
|
12
|
|
|
7
|
|
Impairments
|
86
|
|
|
—
|
|
|
86
|
|
|
—
|
|
Noncontrolling Interest Share of Adjusted EBITDA
|
(1
|
)
|
|
—
|
|
|
(2
|
)
|
|
—
|
|
Adjusted EBITDA
|
$
|
274
|
|
|
$
|
271
|
|
|
$
|
1,147
|
|
|
$
|
1,074
|
|
Series A Preferred Unit distributions (3)
|
(9
|
)
|
|
(9
|
)
|
|
(36
|
)
|
|
(36
|
)
|
Distributions for phantom and performance units (4)
|
—
|
|
|
—
|
|
|
(10
|
)
|
|
(5
|
)
|
Adjusted interest expense (5)
|
(48
|
)
|
|
(45
|
)
|
|
(191
|
)
|
|
(159
|
)
|
Maintenance capital expenditures
|
(40
|
)
|
|
(44
|
)
|
|
(126
|
)
|
|
(114
|
)
|
DCF
|
$
|
177
|
|
|
$
|
173
|
|
|
$
|
784
|
|
|
$
|
760
|
|
|
|
|
|
|
|
|
|
Distributions related to common unitholders (6)
|
$
|
144
|
|
|
$
|
138
|
|
|
$
|
570
|
|
|
$
|
552
|
|
|
|
|
|
|
|
|
|
Distribution coverage ratio
|
1.23
|
|
|
1.26
|
|
|
1.38
|
|
|
1.38
|
|
___________________
(1)
|
Change in fair value of derivatives includes changes in the fair value of derivatives that are not designated as hedging instruments.
|
(2)
|
Other non-cash losses include loss on sale of assets and write-downs of materials and supplies.
|
(3)
|
This amount represents the quarterly cash distributions on the Series A Preferred Units declared for the three and twelve months ended December 31, 2019 and 2018. In accordance with the Partnership Agreement, the Series A Preferred Unit distributions are deemed to have been paid out of available cash with respect to the quarter immediately preceding the quarter in which the distribution is made.
|
(4)
|
Distributions for phantom and performance units represent distribution equivalent rights paid in cash. Phantom unit distribution equivalent rights are paid during the vesting period and performance unit distribution equivalent rights are paid at vesting.
|
(5)
|
See below for a reconciliation of Adjusted interest expense to Interest expense.
|
(6)
|
Represents cash distributions declared for common units outstanding as of each respective period. Amounts for 2019 reflect estimated cash distributions for common units outstanding for the quarter ended December 31, 2019.
|
|
Three Months Ended
December 31,
|
|
Year Ended
December 31,
|
|
2019
|
|
2018
|
|
2019
|
|
2018
|
|
|
|
|
|
|
|
|
|
(In millions)
|
Reconciliation of Adjusted EBITDA to net cash provided by operating activities:
|
|
|
|
|
|
|
|
Net cash provided by operating activities
|
$
|
251
|
|
|
$
|
286
|
|
|
$
|
942
|
|
|
$
|
924
|
|
Interest expense, net of interest income
|
47
|
|
|
43
|
|
|
188
|
|
|
152
|
|
Net income attributable to noncontrolling interest
|
(2
|
)
|
|
(1
|
)
|
|
(4
|
)
|
|
(2
|
)
|
Other non-cash items(1)
|
(2
|
)
|
|
3
|
|
|
2
|
|
|
7
|
|
Proceeds from insurance
|
1
|
|
|
1
|
|
|
1
|
|
|
2
|
|
Changes in operating working capital which (provided) used cash:
|
|
|
|
|
|
|
|
Accounts receivable
|
(21
|
)
|
|
(47
|
)
|
|
(37
|
)
|
|
11
|
|
Accounts payable
|
(32
|
)
|
|
(25
|
)
|
|
78
|
|
|
(6
|
)
|
Other, including changes in noncurrent assets and liabilities
|
24
|
|
|
69
|
|
|
(42
|
)
|
|
5
|
|
Return of investment in equity method affiliate
|
—
|
|
|
(4
|
)
|
|
8
|
|
|
7
|
|
Change in fair value of derivatives (2)
|
8
|
|
|
(54
|
)
|
|
11
|
|
|
(26
|
)
|
Adjusted EBITDA
|
$
|
274
|
|
|
$
|
271
|
|
|
$
|
1,147
|
|
|
$
|
1,074
|
|
____________________
(1)
|
Other non-cash items include amortization of debt expense, discount and premium on long-term debt and write-downs of materials and supplies.
|
(2)
|
Change in fair value of derivatives includes changes in the fair value of derivatives that are not designated as hedging instruments.
|
|
Three Months Ended
December 31,
|
|
Year Ended
December 31,
|
|
2019
|
|
2018
|
|
2019
|
|
2018
|
|
|
|
|
|
|
|
|
|
(In millions)
|
Reconciliation of Adjusted interest expense to Interest expense:
|
|
|
|
|
|
|
|
Interest expense
|
$
|
48
|
|
|
$
|
43
|
|
|
$
|
190
|
|
|
$
|
152
|
|
Interest income
|
(1
|
)
|
|
—
|
|
|
(2
|
)
|
|
—
|
|
Amortization of premium on long-term debt
|
2
|
|
|
2
|
|
|
6
|
|
|
6
|
|
Capitalized interest on expansion capital
|
1
|
|
|
2
|
|
|
2
|
|
|
6
|
|
Amortization of debt expense and discount
|
(2
|
)
|
|
(2
|
)
|
|
(5
|
)
|
|
(5
|
)
|
Adjusted interest expense
|
$
|
48
|
|
|
$
|
45
|
|
|
$
|
191
|
|
|
$
|
159
|
|
|
|
|
|
ENABLE MIDSTREAM PARTNERS, LP
OPERATING DATA
|
|
|
|
|
|
Three Months Ended
December 31,
|
|
Year Ended
December 31,
|
|
2019
|
|
2018
|
|
2019
|
|
2018
|
|
|
|
|
|
|
|
|
Operating Data:
|
|
Natural gas gathered volumes—TBtu
|
426
|
|
|
425
|
|
|
1,666
|
|
|
1,637
|
|
Natural gas gathered volumes—TBtu/d
|
4.62
|
|
|
4.62
|
|
|
4.56
|
|
|
4.48
|
|
Natural gas processed volumes—TBtu (1)
|
236
|
|
|
236
|
|
|
925
|
|
|
877
|
|
Natural gas processed volumes—TBtu/d (1)
|
2.57
|
|
|
2.57
|
|
|
2.53
|
|
|
2.40
|
|
NGLs produced—MBbl/d (1)(2)
|
128.45
|
|
|
136.74
|
|
|
128.58
|
|
|
129.98
|
|
NGLs sold—MBbl/d (2)(3)
|
131.90
|
|
|
145.37
|
|
|
131.59
|
|
|
132.06
|
|
Condensate sold—MBbl/d
|
7.56
|
|
|
5.68
|
|
|
7.41
|
|
|
5.90
|
|
Crude oil and condensate gathered volumes—MBbl/d
|
153.06
|
|
|
76.59
|
|
|
128.46
|
|
|
41.07
|
|
Transported volumes—TBtu
|
551
|
|
|
526
|
|
|
2,254
|
|
|
2,028
|
|
Transported volumes—TBtu/d
|
5.99
|
|
|
5.72
|
|
|
6.18
|
|
|
5.56
|
|
Interstate firm contracted capacity—Bcf/d
|
6.30
|
|
|
6.24
|
|
|
6.31
|
|
|
5.94
|
|
Intrastate average deliveries—TBtu/d
|
2.09
|
|
|
2.21
|
|
|
2.14
|
|
|
2.08
|
|
____________________
(1)
|
Includes volumes under third-party processing arrangements.
|
(2)
|
Excludes condensate.
|
(3)
|
NGLs sold includes volumes of NGLs withdrawn from inventory or purchased for system balancing purposes.
|
|
Three Months Ended
December 31,
|
|
Year Ended
December 31,
|
|
2019
|
|
2018
|
|
2019
|
|
2018
|
|
|
|
|
|
|
|
|
Anadarko
|
|
|
|
|
|
|
|
Gathered volumes—TBtu/d
|
2.42
|
|
|
2.38
|
|
|
2.34
|
|
|
2.21
|
|
Natural gas processed volumes—TBtu/d (1)
|
2.19
|
|
|
2.14
|
|
|
2.10
|
|
|
1.99
|
|
NGLs produced—MBbl/d (1)(2)
|
116.78
|
|
|
119.92
|
|
|
113.20
|
|
|
113.63
|
|
Crude oil and condensate gathered volumes—MBbl/d
|
122.23
|
|
|
48.17
|
|
|
92.70
|
|
|
12.14
|
|
Arkoma
|
|
|
|
|
|
|
|
Gathered volumes—TBtu/d
|
0.44
|
|
|
0.53
|
|
|
0.47
|
|
|
0.55
|
|
Natural gas processed volumes—TBtu/d (1)
|
0.08
|
|
|
0.10
|
|
|
0.09
|
|
|
0.10
|
|
NGLs produced—MBbl/d (1)(2)
|
4.04
|
|
|
6.56
|
|
|
5.42
|
|
|
6.55
|
|
Ark-La-Tex
|
|
|
|
|
|
|
|
Gathered volumes—TBtu/d
|
1.76
|
|
|
1.71
|
|
|
1.75
|
|
|
1.72
|
|
Natural gas processed volumes—TBtu/d
|
0.30
|
|
|
0.33
|
|
|
0.34
|
|
|
0.31
|
|
NGLs produced—MBbl/d (2)
|
7.63
|
|
|
10.26
|
|
|
9.96
|
|
|
9.80
|
|
Williston
|
|
|
|
|
|
|
|
Crude oil gathered volumes—MBbl/d
|
30.83
|
|
|
28.42
|
|
|
35.76
|
|
|
28.93
|
|
__________________
| (1) |
Includes volumes under third-party processing arrangements.
|
| (2) |
Excludes condensate.
|

View source version on businesswire.com: https://www.businesswire.com/news/home/20200219005310/en/
Copyright Business Wire 2020
