EOG Resources (ticker: EOG) reported its Q3 results Thursday, and held its earning call today.
Highlights from the Q3 Results include:
- Raised 2018 Capex Guidance Range to $5.8-$6.0 billion.
- Third quarter 2018 net income of $1.2 billion, or $2.05 per share.
- Q3 operating revenues/other of $4.8 billion.
To read the complete earnings release, please refer to this link.
Heard on the call
Chairman and CEO Bill Thomas said, “[Looking forward to 2019], capital allocation will continue to be based on returns measured against our premium price deck of $40 flat oil and $2.50 flat natural gas prices, no matter if commodity prices improve next year. Our goal of being one of the lowest cost producers in the global oil market has not changed.
Service sector
COO Billy Helms added, “As we near the end of 2018, industry activity is slowing. Consequently, the service sector is experiencing a period of softness in the market. To take advantage of market conditions, we elected to secure some of our existing service providers through the fourth quarter for next year’s program. This will capture favorable prices and sustain the operational continuity of these high-performing service providers into 2019.”
Delaware and Eagle Ford
EVP of Exploration & Production Ezra Yacob said, “In the Delaware Basin, … during the first three quarters of 2018, we put 201 net wells to sales in various spacing and target patterns, which generated more than 150% direct after-tax rate of return.”
“The geology in this basin is variable and complex, so there will not be a single answer on spacing or package size; however, the ultimate goal is to maximize capital efficiency by optimizing the numerous drivers of finding cost, returns and NPV.”
“We’re also making significant progress reducing well costs in a number of areas. Like many operators, we are benefiting from local sand. But most of our gains are from operational efficiencies.”
“Our investment in water infrastructure is paying off. We are moving 95% of our water on pipe. That includes water used for drilling and completion operations, as well as produced water.”
“The well mix in the Eagle Ford during the third quarter included a higher proportion of western acreage wells. While the pay is thinner in the west, there’s less faulting, which allows for longer laterals. The longer laterals you can drill, the better the efficiencies to be gained during drilling and completions.”
“Wells drilled in the west this year are averaging over 3,500 feet per day and are delivering the highest direct NPV of our Eagle Ford program. These long lateral Western Eagle Ford wells will make up a growing proportion of our total Eagle Ford development in the future.”
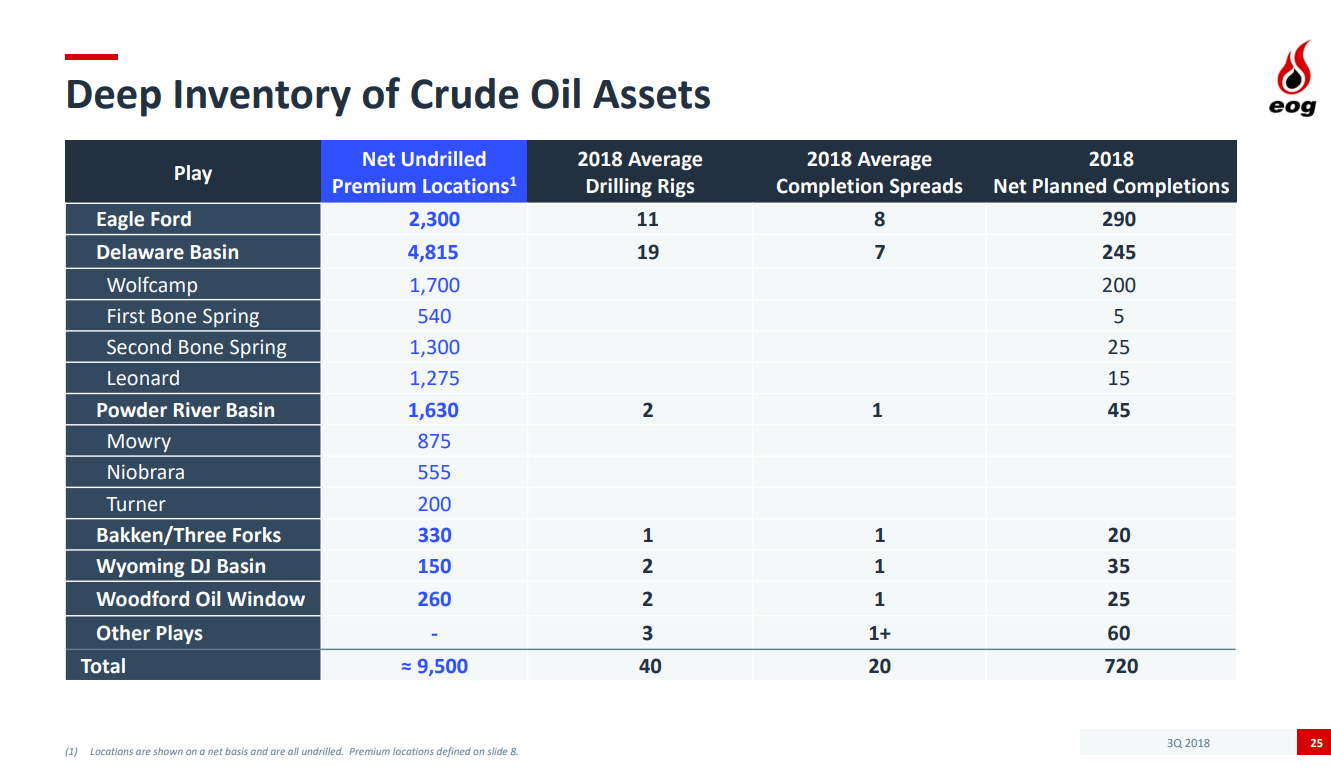
“Across our 520,000 net-acre position in the Eagle Ford Oil Window, we have an inventory of 2,300 net undrilled premium locations. We continue to make progress maximizing value through technical innovation and operational efficiency, which in turn generates additional premium wells.”
“The Eagle Ford remains core to EOG’s business and one of the most important assets driving our production growth.”
Excerpts from the EOG Resources Q3 conference call Q&A:
Austin Chalk and South Texas
Q: On the Austin Chalk. I know this is an emerging play for you, but obviously you’ve been in the play for a while. Where are we in the evolution here? Do you guys feel like you’ve got a better handle on the economics, as well as the productive extent of your sizable acreage position at this point in time?
EVP Exploration and Production Ezra Yacob: I think as we’ve talked about it, we’ve been developing the Austin Chalk. We’ve been co-developing it now with our Eagle Ford program and it’s a little bit more of a complicated play than the Eagle Ford, certainly.
And so, while it’s prospective across our entire South Texas acreage position there, the sweet spots are a little more discontinuous. And we’ve done a very good job integrating not only core data and log data that we’ve collected while we’ve been developing the Eagle Ford, but we’ve also tied that into our seismic coverage, which extends across our entire acreage position.
So, yeah, we’re feeling very good with it. The benefit that the Austin Chalk also has is that since we do co-develop it with the Eagle Ford and it’s within our core area, it benefits from a lot of the existing infrastructure. And, obviously, all the operational performance that we have there that we continue to increase in the Eagle Ford, the Austin Chalk continues to benefit from that.
So this quarter we brought on 10 net wells. They had a average 30-day rate there of just over 1,800 barrels of oil per day. And so, we are very happy with the performance of it.
Spacing in the Permian
Q: If I look at sort of where you are in spacing in the Delaware Basin, there’s a fairly-wide range from 660 feet up to 1,000 feet, and it doesn’t seem to be a function of depth or oil cut. Can you give some color? What’s driving that well spacing? And how fixed are those numbers?
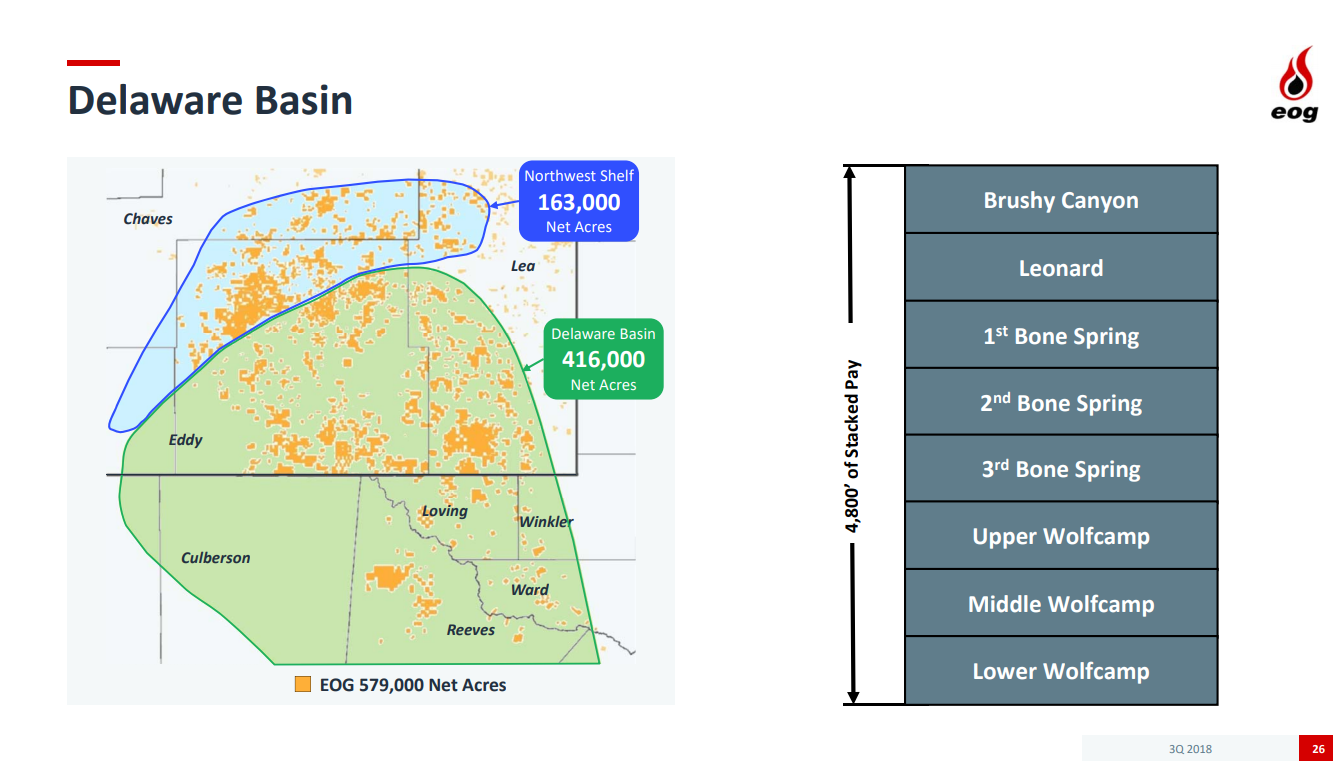
EVP Exploration and Production Ezra Yacob: So that’s a good observation you have. I appreciate the question. The first part of our well spacing, it does actually begin with the oil cut. I think our announced type curves for the oil play where we have 226,000 net acres is based on 660-foot spacing. And then for our combo play, which is a little bit shallower, a little bit less of an oil cut, that type curve is based on an 880-foot spacing. And that would be some of our Reeves County acreage down there.
But then more than that, the spacing really across the Permian is going to be tied to the local geology. We continue to kind of monitor the long-term performance, a lot of those spacing and different targeting patterns that we’ve tested. And we’ve discussed those on past calls where we’ve been testing spacing in the oil window down to 500-foot to 700-foot spacing, depending basically on the local geology, the number of targets, and as such. It is a complicated play in the Delaware Basin.
But I think what we see this year is we’ve made tremendous progress on defining kind of our optimal spacing and targeting packages for our core acreage positions. We brought 180 wells in the Wolfcamp to sales this year, and it’s reinforced that we feel very confident with our announced resource potential on that type curve at 1.3 million barrels of equivalents. And again, that’s for a 7,000-foot lateral at 660-foot spacing. I think the way to think about that 660 feet is if you just look at our remaining premium inventory, that’s going to be a good average over that acreage position.
Q: Feels like the basin really kind of benefits larger well-organized producers kind of like EOG with scope and scale. So, are there any bolt-ons that might make sense down the line for EOG, understanding that you guys are not into buying big companies?
EVP Exploration and Production David Trice: Yeah, again, I think I’d reiterate what Bill said earlier. I mean, we’re certainly not interested in any of these expensive corporate-level acquisitions. We’re always looking to add high-quality acreage at low cost. And so, if some bolt-on would make sense and it’s low cost, then we would certainly look at it. But again, our focus is more on the exploration side, finding low cost, high-quality acreage.
New Mexico
Q: Could you comment on some public data that’s out there? Just showing, in New Mexico the well results being incrementally lower than in prior years. And if that’s related to data integrity, or if there’s something else going on and this is just an interim event.
EVP Exploration and Production Ezra Yacob: With the results in the Delaware Basin there in the New Mexico portion, I’m not sure if I can speak directly to the state data that you’re seeing, but what I will say is we’re very pleased with the results that we’re seeing out there. As I discussed earlier in the opening remarks, all of our well performance are actually outperforming their respective type curves for each of the plays that we’re drilling.
Premium locations
Q: With the discussion of the premium locations. Are some of the locations are better than others? In other words, since all the premium locations have high potential for outperforming, what informs the choice to develop some of them now and wait on others for later?
Chairman and CEO Bill Thomas: Yes, all the premium locations are quite outstanding. They’re quite different, I believe, than the average well that the industry’s drilling. So they’re at a very high, elevated level. And, of course, it’s a huge inventory. It’s 9,500 locations and some of them are much better than others. And as we continue to add to that premium inventory, our goal is to bring the quality of the inventory up, just like we’d drill, build the quantity of the inventory.
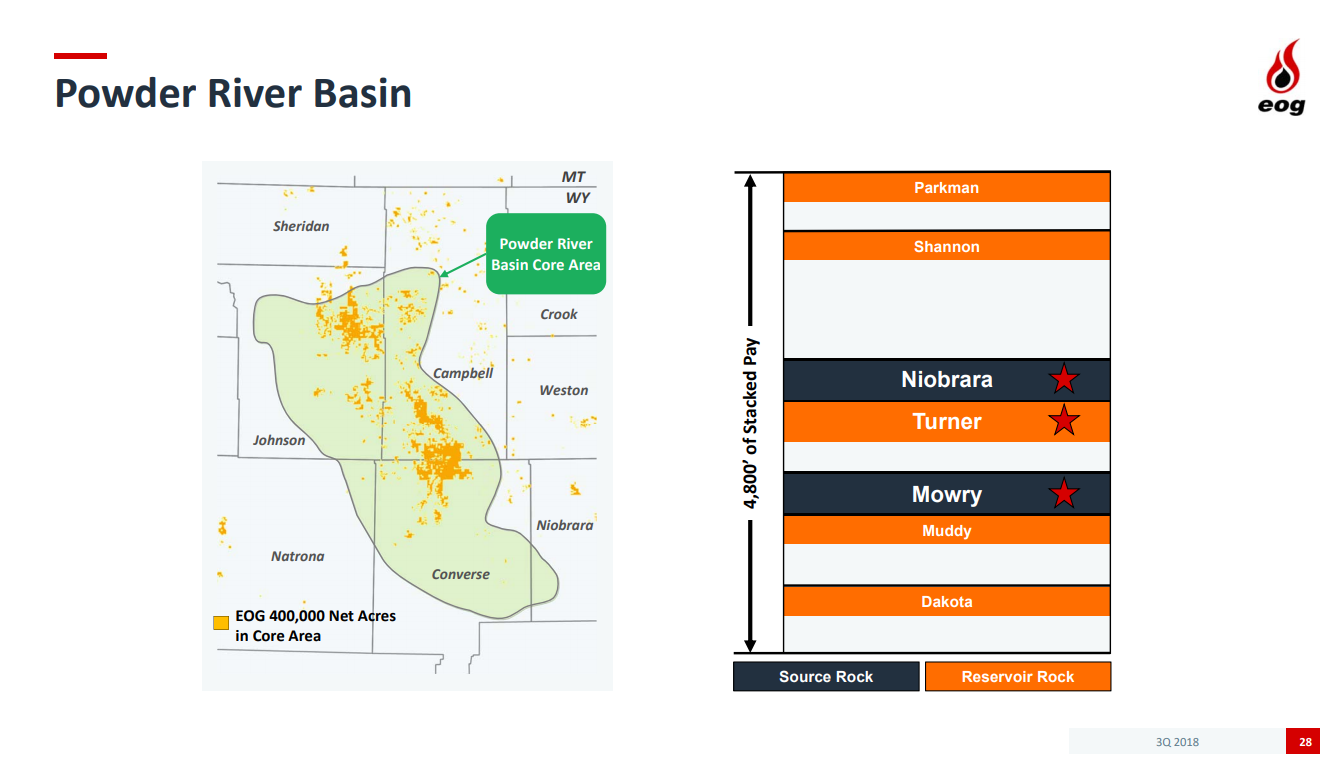
Q: On the call, you mentioned there’s going be a spacing test of the Mowry and the Niobrara together. Since the Turner wasn’t mentioned, does that imply that the Turner sweet spots are discrete from the premium Mowry and Niobrara locations?
EVP Exploration and Production David Trice: On the Turner, we feel like we understand that play a lot better. We’ve been drilling the Turner for years and we’ve done various tests over the years, and so we have a good handle already on what the spacing should be in the Turner. Just the fact that the Mowry and the Niobrara are new, we’re going to go ahead and do some spacing tests there, similar to what we did in the Woodford. And so, we’re planning to do those. Those are two separate tests and we’re going to do those at 660-foot spacing.


