The NFL draft will take place next week and new millionaires will be freshly minted without having played a single down in a single NFL game. They will be paid based upon expectations and not actual results. Investors want own stock based upon future results and not historic metrics. So when it comes to executive pay, it is all about what have you done for me lately, and the oil and gas industry is no different.
The oil and gas industry in the United States is unique compared to the rest of the world.
For the most part, large swaths of oil companies across the globe are state run and state controlled, as are the resources themselves. Saudi Arabia, Russia, Iran, and China all maintain control of their oil and gas industry through national government. In the U.S., oil and gas companies are privately run and only subject to national laws and restrictions placed on the industry by the U.S. government.
Decisions about capital spending, where and when to drill, and the overall direction of the company lie in the hands of the corporate executives and not the national legislature or a minister of oil and gas. This dynamic has resulted in drastically different effects on drilling, production, and transportation than is seen elsewhere in the world.
In contrast to various existing forms of state-ownership, companies operating in the U.S. primarily seek to grow cash flow and maximize returns to stakeholders. The commitment to ‘shareholder value,’ as a guiding principle, is to this day the hallmark of corporate leadership across the U.S. economy. But this focus on shareholder value and growth has brought with it a new set of challenges in the modern day oil and gas industry.
What drives industry executives in their decision making process? And who oversees the parameters established to determine how successful these decisions are? The answer lies in the realm of a pay-for-performance construct established by a company’s board of directors and enacted by corporate executives.
This analysis looks into seven E&P companies’ operations through proxy statements outlining the pay for performance structure. The companies used for the analysis are Anadarko Petroleum, Antero Resources, Continental Resources, Devon Energy, EOG Resources, Pioneer Natural Resources, and Range Resources.
The Rise of U.S. Oil and Gas: Focused on Growth and Returns to Shareholders
The past decade has been extremely profitable for the major oil companies as oil prices rose dramatically from 2003-08. There was a small blip on the radar screen in 2009 with the U.S. recession, but oil recovered and ascended above $100/Bbl for much of the early 2010s. During this period, there have been a number of important developments.
The global dominance of state run oil companies gave OPEC a large swath of influence over the global market. It was a belief of OPEC that this dominance was not capable of challenge from “upstart” companies drilling in the U.S. What transpired in the U.S. following the advent of the shale revolution was a fast and furious barrage of oil production with the target of 20% growth achievable for the purpose of maximizing stock price and obtaining corporate objectives laid out by the boards of directors.
With state controlled oil and gas in other areas of the globe, the flow of oil and gas production is strictly under the jurisdiction of the government and can be quickly regulated to address supply concerns. With a capitalist structure, restriction on production is a result cash flow as opposed to government intervention. With the capital markets ready to oblige to expanding debt and equity offerings, U.S. oil and gas production realized a significant growth spurt.
The Rise of the Pay-for-Performance Paradigm
In the early 1990s, President Bill Clinton signed a new tax law altering the regulations on executive compensation. This new law changed how companies were able to shield compensation from taxes. Soon after his election, Clinton joined forces with Congress to limit corporations’ ability to deduct executive compensation from their taxes, as they do for ordinary workers’ wages and other expenses of doing business. Clinton’s team imposed a limit of $1 million for taxable deductions for executive compensation.
A major exemption was put in place as part of this new law. Compensation that was dependent on the firm’s performance was exempt from the threshold. In practice, that meant pay in the form of shares of the firm’s stock, or options to buy them, would encourage corporate executives to be increasingly attentive to investors’ interests. Congress felt that pay in the form of stock would force executives to earn their keep by protecting the value of the company and if the price of the stock rose, investors would benefit as well.
The key component of this legislation isn’t the overall pay of the executives, but the performance based incentives that were moved front and center. In order to achieve the compensation plan, executives would be evaluated by a set of parameters laid out by the company’s board of directors.
In 2002, the Sarbanes-Oxley Act was established to increase transparency in corporate governance and financial reporting. Among the most prominent change from Sarbanes-Oxley Act (SOX) was a shift in perspective. Prior to SOX, it was widely acknowledged that the board serves management and is largely responsive to the corporate executives. SOX altered that mentality to a perspective that management is working for the board.
SOX also recognized that director independence is necessary for the board to serve effectively as a check on management. It allows for director liability if the board fails to exercise the appropriate oversight. In general, boards take their independence and accountability more seriously, as well as being astutely aware of the needs and overall best-interests of the shareholder.
This new legislation also regulated and increased transparency on executive compensation. SOX banned the executive perk of corporate loans—the so-called Bernie Ebbers rule—named for the former WorldCom CEO. It also gave the SEC the freedom to regulate executive bonuses and other “extraordinary payments.” This gave investors more insight and input into executive pay and perks which could be viewed as wildly skewed or excessive, the consistency of pay within an organization, and decisions on golden parachutes, stock options, as well as retirement and severance packages.
The board of directors of a given corporation is responsible for laying out the incentive plans for the executives. Comparative analytics are run, peer sets constructed for comparative analysis, and paradigms are built as to what objectives best suit the direction and future of the company. The result is an incentive plan that set the course of action and guides executive decision making to attain a stable and sustainable future for the company and the shareholders alike.
What Factors are considered by Oil and Gas Companies?
The performance of a given company can be assessed and analyzed in many different ways. Is shareholder return the biggest factor? What about financial gains, asset management, or operational excellence? Consolidating these parameters into a cohesive structure is a large part of what the pay for performance structure is all about. After reviewing proxy statements, the chart below shows a conglomeration of some of the trends and overall structure that are present in the pay for performance guidelines.

The structure as laid out in the chart revolves largely around the financial and operational performance of the company. This would seem to be a predictable pattern as these aspects are easily quantifiable and are key components of internal strategy and external performance analysis. In order to be sustainable, a company must generate cash flow, keep costs within reason, and allocate capital efficiently. The majority of these metrics utilize these concepts as an underlying factor.
The ‘Other/Discretionary’ category is a wild card that several companies take to varying extents. Some companies analyze things like ‘value to the company’ or ‘performance relative to expectations.’ While the financial performance and the operational performance is largely quantifiable, there are elements of compensation that are subjective. Nobody knows the value of an employee (or lack) like the people that work with them every day.
Some companies follow a more quantifiable approach to compensation, while others leave a lot of leeway to grade executives on the intangibles. The rules set forth in the law passed by Clinton and Congress aren’t specific about the structure of the compensation paradigm or the necessity of it to be quantified. This has led to a wide array of factors leading to a compensation package.
EnerCom Database Metrics
As a part of EnerCom’s proprietary database, we track the performance of five key metrics that that have statistical significance with relation to price to cash flow multiples. We refer to these metrics as value drivers. These value drivers are very similar to the metrics used by these oil and gas companies to evaluate their performance as it relates to compensation. The metrics used by EnerCom are Three-Year F&D Cost, LOE and G&A per Boe, Three-Year Production Replacement, Capital Efficiency, and Debt to Market Cap. Here is how the seven companies fared in those categories relative to EnerCom’s U.S. E&P universe of 97 companies:
Three-Year F&D Cost
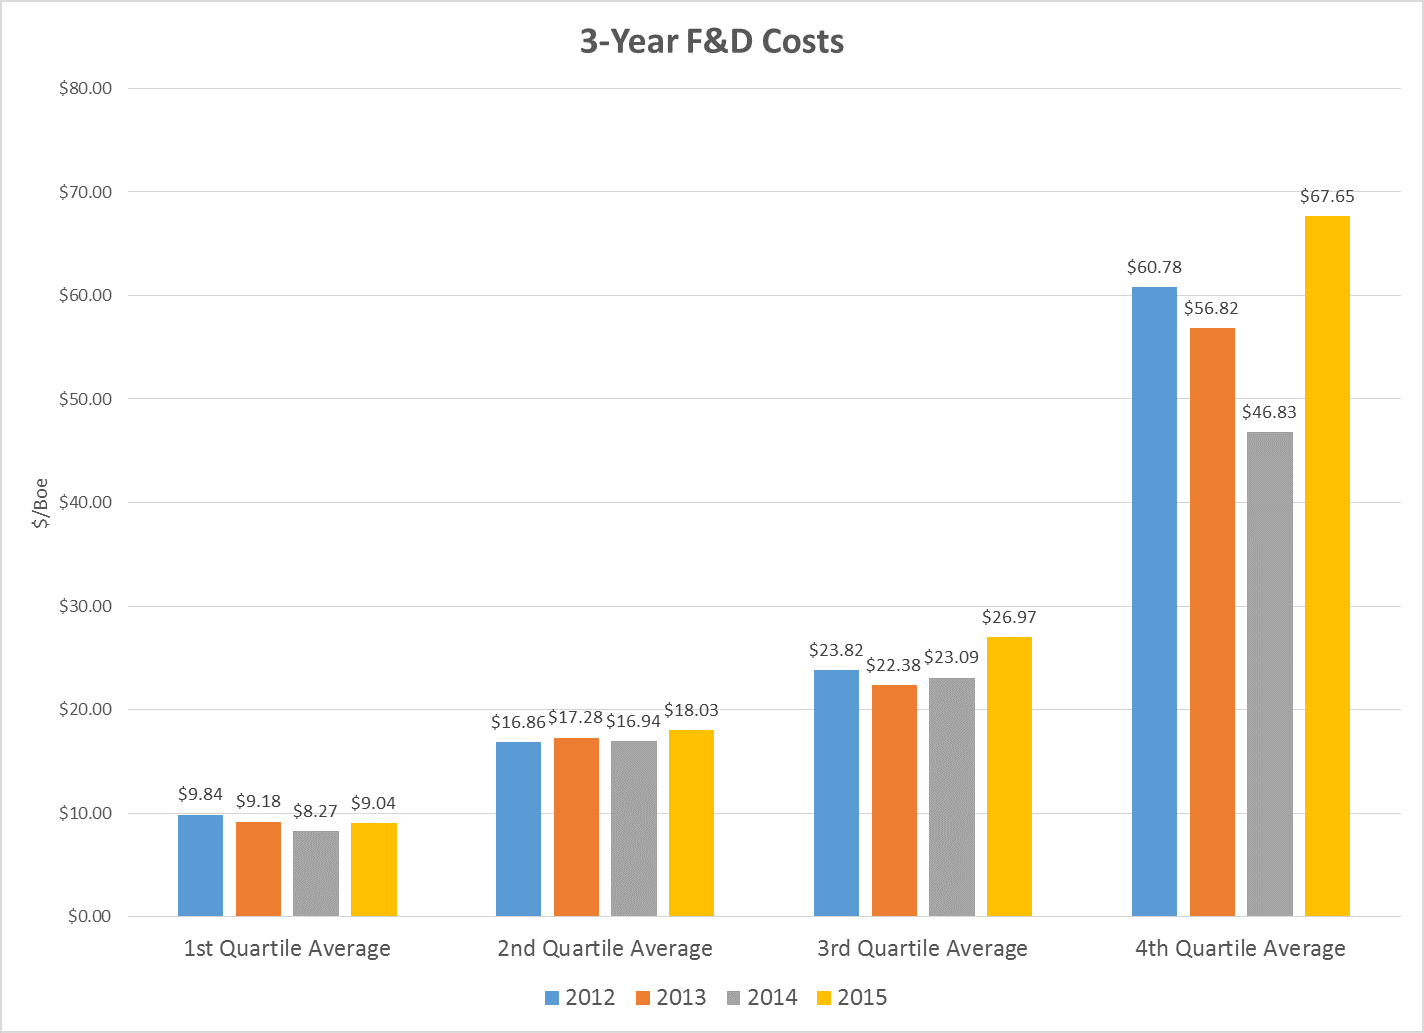
| 2012 | 2013 | 2014 | 2015 | ||
| APC | $15.26 | $15.12 | $16.12 | $26.98 | |
| AR | NA | $3.83 | $3.96 | $4.63 | |
| CLR | $12.58 | $12.29 | $13.06 | $17.76 | |
| DVN | $20.46 | $24.52 | $29.06 | $62.71 | |
| EOG | $26.67 | $23.62 | $18.66 | $20.08 | |
| PXD | $16.76 | $125.12 | $102.29 | NA | |
| RRC | $4.95 | $4.71 | $4.40 | $4.29 | |
Lease Operating Expense and G&A per Boe
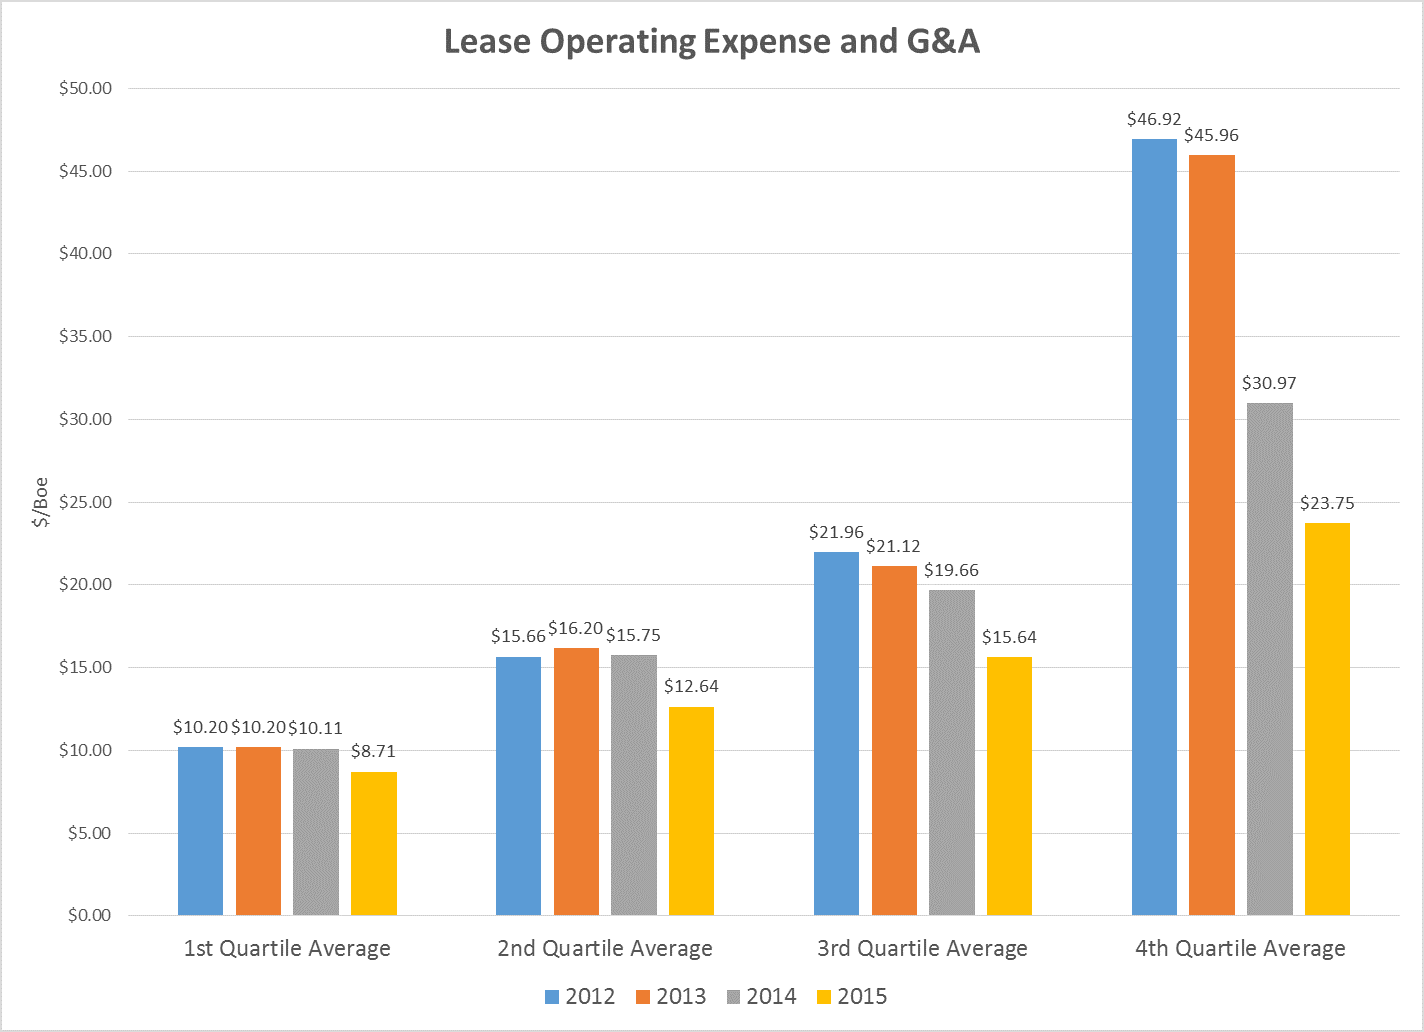
| 2012 | 2013 | 2014 | 2015 | |
| APC | $16.42 | $15.04 | $15.98 | $13.02 |
| AR | NA | $10.66 | $12.97 | $11.09 |
| CLR | $15.30 | $15.29 | $13.95 | $9.22 |
| DVN | $12.73 | $13.23 | $15.12 | $13.49 |
| EOG | $14.80 | $16.33 | $17.02 | $14.03 |
| PXD | $19.21 | $19.13 | $18.73 | $15.96 |
| RRC | $12.11 | $13.57 | $9.32 | $8.05 |
Three-Year Production Replacement

| 2012 | 2013 | 2014 | 2015 | |
| APC | 150% | 162% | 162% | 90% |
| AR | NA | 1898% | 1635% | 852% |
| CLR | 822% | 774% | 673% | 329% |
| DVN | 146% | 115% | 120% | 50% |
| EOG | 150% | 167% | 201% | 159% |
| PXD | 243% | 36% | 45% | NA |
| RRC | 802% | 704% | 653% | 469% |
Capital Efficiency

| 2012 | 2013 | 2014 | 2015 | |
| APC | 171% | 190% | 227% | 15% |
| AR | NA | 212% | 436% | 257% |
| CLR | 425% | 453% | 442% | 133% |
| DVN | 100% | 89% | 113% | 34% |
| EOG | 131% | 176% | 226% | 93% |
| PXD | 210% | 29% | 32% | NA |
| RRC | 356% | 342% | 461% | 134% |
Debt to Market Cap
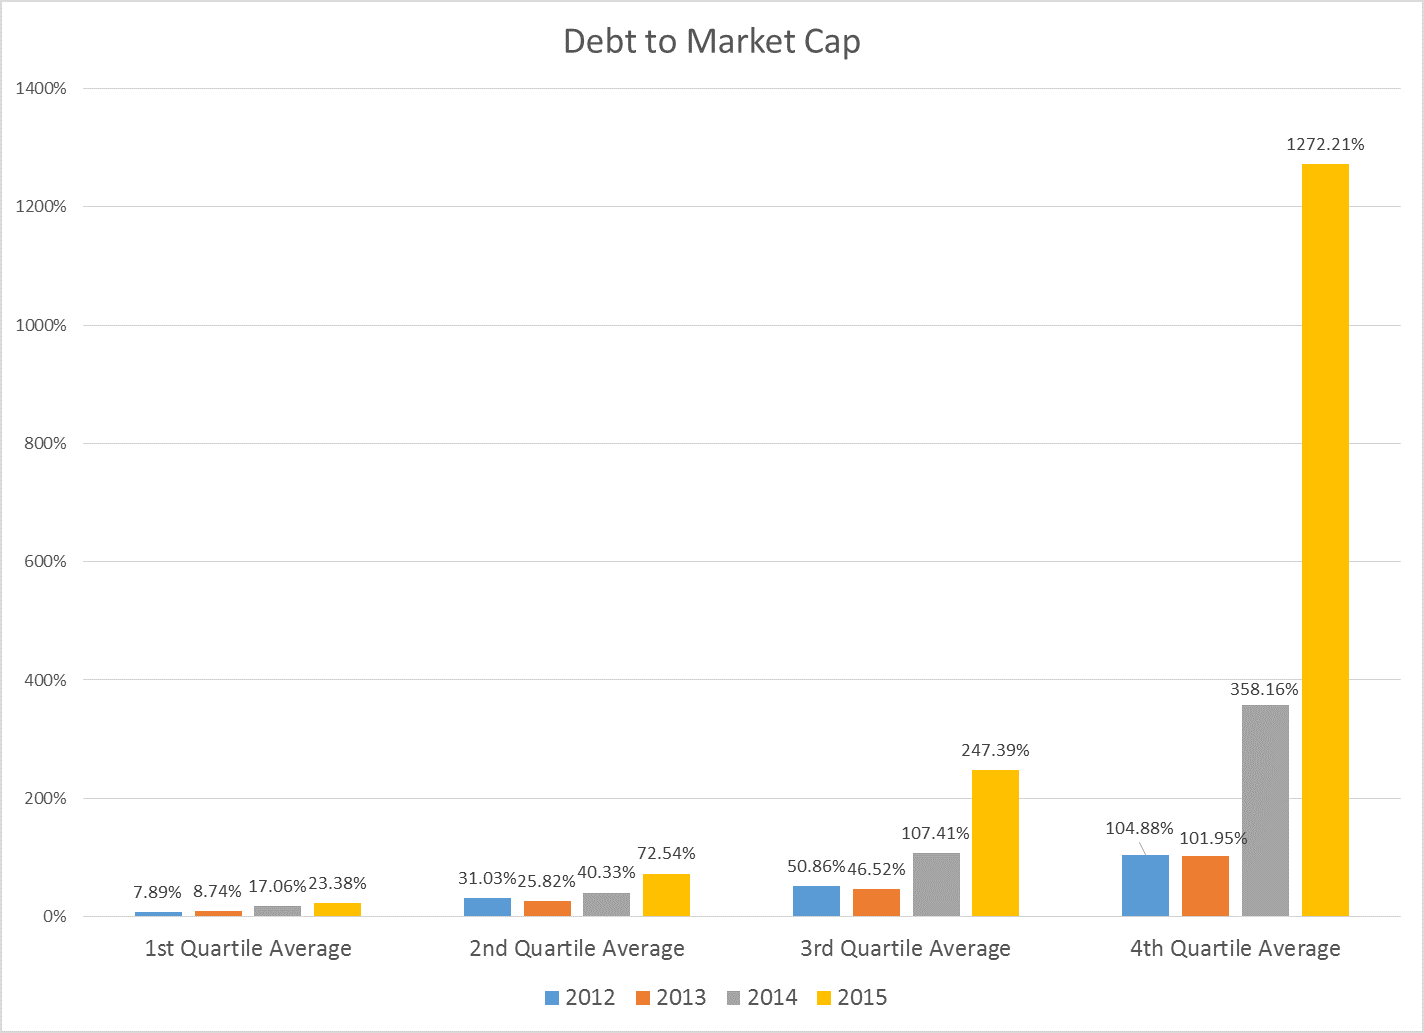
| 2012 | 2013 | 2014 | 2015 | |
| APC | 36% | 34% | 36% | 64% |
| AR | NA | 13% | 41% | 78% |
| CLR | 26% | 23% | 42% | 83% |
| DVN | 55% | 48% | 45% | 100% |
| EOG | 19% | 13% | 12% | 17% |
| PXD | 28% | 10% | 12% | 20% |
| RRC | 28% | 23% | 34% | 64% |
Seven Actual Examples: How are U.S. Oil and Gas Execs Incentivized?
Anadarko Petroleum (ticker: APC)
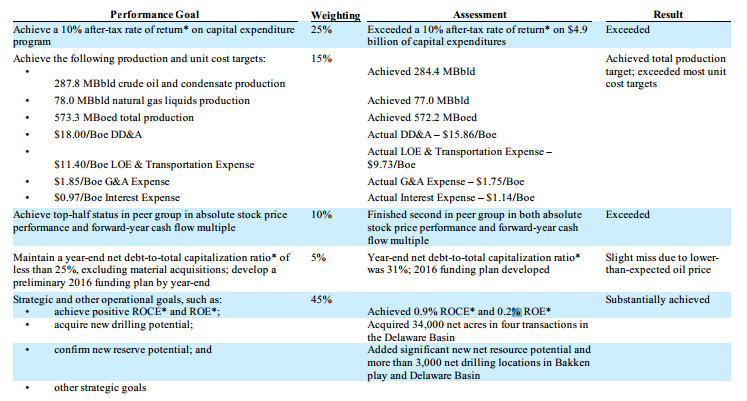
Anadarko Petroleum utilizes a set matrix of quantifiable metrics to incentivize their executive team to perform. The focus for Anadarko is growth of sales and reserves, keeping capital expenditures within expectations, generating cash flow, and maintaining safe operations.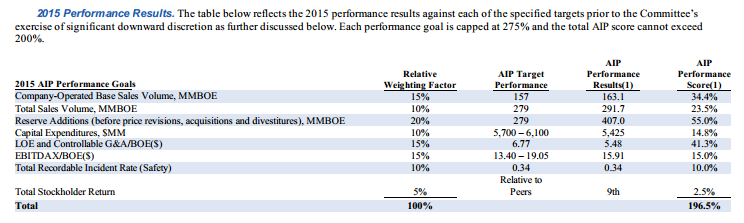
Anadarko has maintained the same performance goal categories for several years, the targets have changed, but the factors have remained largely the same. This could be because Anadarko believes that these factors are the most influential pieces to driving company growth and health in any cycle. Another element could be that these factors, with the exception of EBITDAX, are largely insulated from major price fluctuations that are outside the realm of control for management. In regards to sales, reserves, and LOE and G&A, they are numbers that can be continually improved as opposed to reaching a threshold where a cost cannot be reduced any further.
Antero Resources (ticker: AR)
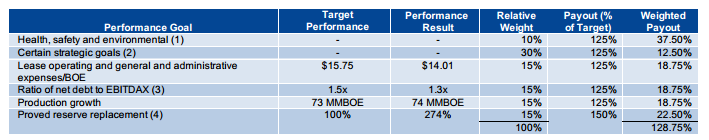
Antero Resources lays out the focal points of their strategy with an emphasis on discretionary measures and a focus on safety, compliance, and planning. With 40% of the performance dedicated to discretionary measures, and 60% dedicated to financial and operating measures, Antero seeks to strike a balance between the quantifiable performance of the company and the factors that they feel are internally important to keeping the company in line with future growth and stability. Goals for the 2015 fiscal year are in the chart below (Antero is yet to release goals for 2015).

The financial metrics largely emphasize the generation of cash flow and the maintenance of leverage relative to that cash flow. As of year-end 2015, EBITDAX was $1,083 million according to EnerCom’s database, which is largely flat from 2014’s $1,088 million, and significantly higher than $280 million in 2013. Net Debt to EBITDAX clocked in at 4.3 times, which is up from 2014’s number of 3.78 times and down significantly from the 7.36 times in 2013. Antero was able to increase cash margin to $2.43/Boe in 2014 from $1.82/Boe in 2013.
Operationally, the upside and downside of using metrics like development cost and G&A is that reducing costs alwas helps the margin. However, there is only so much that costs can be cut before they have bottomed out or cutting them more begins to negatively effect the business. For the last three years (2013-2015), OPEX and G&A per unit for Antero were $1.78/Mcfe, $1.86/Mcfe, $1.80/Mcfe, respectively.
Continental Resources (ticker: CLR)
Continental Resources takes a different approach from its competitor in that it does not work to quantify the necessary results, but provides a general guideline that as to the value of the executive to the team. The list of factors in consideration for executive compensation are:
- The overall performance of the company;
- The executives contribution to the overall performance of the company;
- The executives business responsibilities;
- The executives compensation relative to other executives;
- The executives current compensation arrangement; and
- The executives ability to enhance the ability of the company to generate long term shareholder value.
The approach taken by Continental Resources leaves the decision making in the hands of the board and the executives to determine the value of employees. You could consider this a more Aristotelian approach to compensation in that the guiding light is the betterment of the company and working to make the best choice possible.
Continental does make note of pointing out metrics that provide some guidance to the decision making: production growth, reserve growth, safety performance, stock price performance, finding and development cost, production costs, earnings, cash flow, operating income and return on equity all factor into the evaluation of the performance of the company.
Reducing the focus on quantifiable metrics leaves Continental flexible in their compensation analysis. It also gives the appearance of being subjective. G&A as a percentage of oil total revenue for Continental in 2013, 2014, and 2015 were 4.0%, 3.9%, and 7.1%, respectively. A percentage ratio below 10% is considered excellent.

Devon Energy (ticker: DVN)
Devon Energy blends the thought processes of Anadarko with the some of the less quantifiable measures of Continental. The layout of the incentive paradigm provides set goals and in some cases quantifiable numbers to achieve. Financial and operational measures that comprise 30% of the total, and relative stockholder performance carries a 15% weight. 40% of the performance weight is dedicated to the overall asset portfolio and the E&P productivity initiatives.

One element that is different about the Devon compensation matrix, is the component of business atmosphere. ‘Learning and People’ and ‘Improve Business Environment’ are two pieces you don’t see elsewhere. By highlighting the need to promote from within and create a low risk environment, the company hopes to generate an environment where the employees can focus on their work and that focus will show through in company results. On February 18, 2016, Devon announced it was laying off 1,000 employees.
Devon’s production peaked in 2013 at 253 MMBoe, and fell slightly to 245 MMBoe and 248 MMBoe in 2014 and 2015, respectively. The target production for compensation purposes was 237.1 MMBoe, lower than both the 2011 and 2012 production of 241 MMBoe and 250 MMBoe, respectively. Though the cash margin target achieved in 2014, the score of 125% for this metric would seem a little high given that they only beat the target by less than 1%.
EOG Resources (ticker: EOG)
EOG Resources has a similar framework to Devon in how they breakdown the compensation of executives. The column indicating results does not use a numerical value to show the level of compensation and instead indicates whether the goal was exceeded or not.
Similar ideas prevail as with other companies in the quantification of the performance. The costs associated with the production were targeted more in the range of maintaining operational performance as opposed to improving these metrics. While EOG has improved their G&A expense through the last several years, the target of $1.85/Boe was the exact same as the G&A expense in 2014.
EOG targeted aggressive growth in production during 2014, 16% growth was achieved over 509 MBoepd in 2013. However, EOG let off the throttle in 2015 by targeting 573.3 MBoepd in production, and barely fell short of that number. This is a noticeable shift in mentality from the generally targeted 20% growth for companies, it reflects the company’s thinking on growing shareholder value through restraint.
Two components that you don’t see much of elsewhere, is the return on capital and the acquisition of assets as a strategic objective. Most companies in this analysis look at capital expenditures as a function of how much money was spent. EOG chooses to look at capital employed as a return metric. The rate of return on capital employed goes towards evaluating how effective the expenditure was as opposed to just how much was spent. Also, in 2014 EOG had a performance target of selling $200 million in non-core assets, which was achieved by selling $569 million of non-core assets. In 2015, the target was to acquire new drilling potential, and was accomplished through 34,000 net acres in four transactions.
Pioneer Natural Resources (ticker: PXD)
Pioneer natural Resources falls back to the more basic compensation approach as seen with Anadarko by streamlining targeted metrics to a few. Pioneer lays out target, results, weighting, and payout as a percentage of target. Improving production and reserves, reducing leverage relative to cash flow, and cutting costs are tenets of most oil and gas companies.
The production increase was a 9.0% increase from the 2014 production of 67 MMBoe; since 2008, Pioneer has averaged a 9% increase in production. According to EnerCom’s database, which accounts for LOE, production tax, and transportation expense as part of operating expense, Pioneer’s average OPEX and G&A since 2008 is $17.40/Boe, compared to $15.96/Boe in 2015. However, the base lease operating expense laid out by Pioneer met and exceeded the expectation easily at $14.01/Boe, compared to the target of $15.75. Pioneer’s realized results on base lease operating and G&A from 2014 was $15.22/Boe.
Including the proved reserve replacement, and the net debt to EBITDAX, the performance of the company in 2015 met and exceeded all the criteria laid out by Pioneer.
Range Resources (ticker: RRC)
Among the most quantified companies is Range Resources. Range weights their five objectives towards finding and development, EBITDAX and stock performance. Missing from the structure of Range is the actual cash costs associated with production. This is somewhat accounted for in EBITDAX, but several of the other companies look at LOE, or cash margin as a function of production efficiency. Range instead chooses to focus on finding and development costs as a key performance indicator.
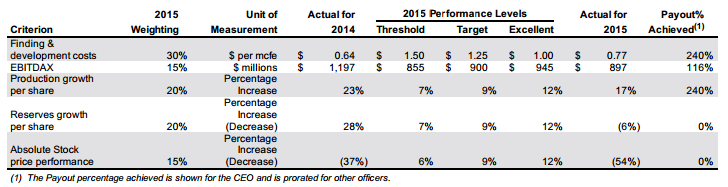
The F&D target for Range has an ‘excellent’ threshold of $1.00/Mcfe, which is significantly higher than the $0.64/Mcfe that was realized in 2014, making this metric very achievable. Even dating back to 2009 and 2010, Range’s F&D costs were $0.84/Mcfe and $0.69/Mcfe respectively. The same can be said for the production growth and reserve growth, with 2014 levels already significantly higher than the 2015 targets. Range has increased production at an average of 20% per year since 2008, making the 10% threshold for ‘excellent’ performance seem easy to surpass.
The only targets Range failed to hit was the EBITDAX target and the stock performance target. Stock performance is a difficult metric to hit given that Range uses an absolute stock growth instead of assessing relative to their peers. In 2015, the downturn of commodity prices was a likely culprit for the downturn in stock price.
What are the Effects of Stock Incentives?
The proliferation of stock as a compensation medium has led to a strong correlation between the overall market performance and the level of executive compensation. The Economic Policy Institute analyzed the performance of the stock market relative to executive compensation since 1965. The results of their analysis shows a change in the connection between the stock market and compensation following the implementation of the new taxation laws under Clinton. From the early 1990s on, the market and compensation moved in unison. Largely due to the increase of stock incentives as a means of remuneration instead of cash.
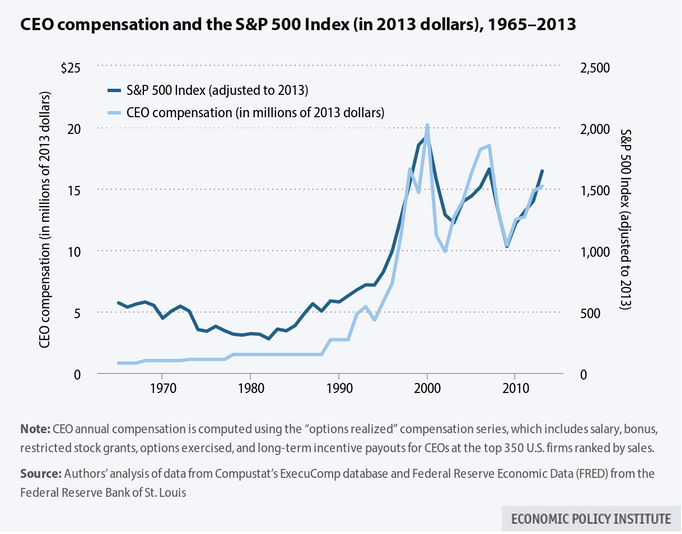
The effect of changing the taxation laws resulted in the increase in stock incentives awarded to executives of corporations. The exemption of performance-based awards from taxation would lead to the increase in these methods of compensation. In favor of Clinton’s plan, the compensation level does mirror the performance of stock, which would indicate that CEO’s are incentivized to have their stock perform well to attain a higher compensation level.
Is Pay for Performance a True Incentive?
Placing the Clinton taxation plan front and center, it is tough to argue that corporations have an incredible amount of options to pay executives in cash or without utilizing tax-exempt stock incentives. Certainly, the use of stock compensation aligns the shareholder and the executive with the common goal of increasing stock price performance. But how effective are the incentives at reaching corporate goals or really driving performance improvements?
In most instances that we looked at, performance metrics are more about retaining a status quo than driving increased efficiencies. Performance goals are largely attainable to executives, while the ones that are tougher to reach are in the minority. In a good portion of the cases, the executives are still compensated to some degree for performance even if the target isn’t reached. It amounts to a game of horseshoes or hand grenades where close is good enough.
Several companies that we looked at utilize a more subjective approach to compensation by using performance goals that are not quantifiable and it is left up to the board of directors or the compensation committee to reach an agreement on how the executives should be compensated.
Overall, executives in the oil and gas industry receive compensation for hitting targets that fit the direction of the company and are focal points of industry performance. Some companies have broader goals than others. When an executive hits all of the targets for performance, it is easy to say that they are doing exactly what is asked of them.
Looking historically, many of the companies EnerCom assessed had largely left performance goals the same. While the numbers had changed, the categories had not. This makes the compensation structure congruent year over year, but it also negates the idea of an evolving corporate strategy being the focal point of pay for performance. Perhaps it is time the boards of oil and gas companies reassess the goals for its management teams in the company’s pay for performance structure and start asking their executives how capital is allocated.
