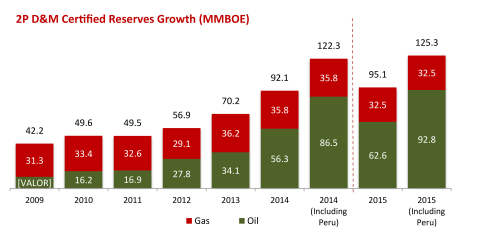
GeoPark Announces Certified 2015 Oil and Gas Reserve Increase with Record 2P Reserves of 125 MMBOE
Proven Developed Producing (PDP) Reserves Up 25% with 150% Reserve
Replacement / Proven (P1) Reserves Up 13% with 211% Reserve Replacement
/ Proven and Probable (2P) Reserve NPV Estimated at $1.6 Billion
GeoPark Limited (“GeoPark”) (NYSE: GPRK), a leading independent Latin
American oil and gas explorer, operator and consolidator with operations
and producing properties in Colombia, Chile, Brazil, Argentina and Peru1,
announced today its reserves assessment as of December 31, 2015
independently certified by DeGolyer and MacNaughton (“D&M”) under PRMS
methodology.
This Smart News Release features multimedia. View the full release here:
http://www.businesswire.com/news/home/20160229006904/en/
(Graphic: Business Wire)
All figures are expressed in US Dollars.
Year-End 2015 D&M Certified Reserves Highlights
-
After producing 7.4 MMBOE in 2015, total net proven developed
producing (“PDP”) reserves in Colombia, Chile and Brazil increased 25%
(3.5 MMBOE) to 17.3 MMBOE. For each BOE produced in 2015, 1.5 BOE of
PDP reserves were added with a PDP reserve replacement index (“RRI”)
of 150%
-
Total net proven (“P1”) reserves in Colombia, Chile and Brazil
increased 19% (8.1 MMBOE) to 52.3 MMBOE and, including Peru, to 71.1
MMBOE. P1 reserve life index (“RLI”) in Colombia, Chile and Brazil
equaled 7.1 years and, including Peru, 9.6 years. For each BOE
produced in 2015, 2.1 BOE of P1 reserves were added with a P1 RRI of
211%
-
Total proven and probable (“2P”) reserves in Colombia, Chile and
Brazil increased 3% (3.0 MMBOE) to 95.1 MMBOE and, including Peru, to
125.3 MMBOE. 2P RLI in Colombia, Chile and Brazil equaled 12.9 years
and, including Peru, equaled 16.9 years. For each BOE produced in
2015, 1.4 BOE of 2P reserves were added with a 2P RRI of 141%
-
Total net present value (“NPV”) after tax of 2P reserves was $1.65
Billion in 2015 compared to $1.69 Billion in 2014
James F. Park, CEO of GeoPark, said: "Our independently-certified oil
and gas reserve increase this year represents another performance record
and important 2015 achievement – reflecting the quality of our assets,
our financial discipline and focus, and the experience and capabilities
of our team. Despite the low oil price environment and significant
cutbacks in new capital investment, our team was able to pivot and adapt
our program to explore and develop our high quality low cost assets,
including the discovery of three new oil fields in Colombia, while also
keeping our long-term business plan and growth on track. Our reserve
additions followed the production of 7.4 million boes during the year
and the reduction of 4.7 million boes of uneconomic reserves from the
impact of low oil prices and technical revisions. Importantly, we had
significant increases in our PDP and P1 reserves last year, which
represent the lowest risk and most accessible oil and gas reserves. Our
overall reserve increase also led our certified net present value of our
2P reserves to reach $1.6 Billion -- approximately in line with 2014
numbers even after adjusting for a lower oil price forecast."
2015 Year-End D&M Certified Reserves Summary
Consolidated:
GeoPark engaged D&M to prepare an independent appraisal report of
GeoPark’s reserves as of December 31, 2015 covering 100% of GeoPark’s
assets.
As of December 31, 2015, and following oil and gas production of 7.4
MMBOE in 2015, D&M certified 2P reserves of 95.1 MMBOE (composed of 66%
oil and 34% natural gas); distributed 49% in Colombia, 44% in Chile, and
7% in Brazil. Including Peru, D&M certified total 2P reserves of 125.3
MMBOE (composed of 74% oil and 26% natural gas); distributed 37% in
Colombia, 33% in Chile, 24% in Peru and 6% in Brazil.
|
|
|
Country
|
|
|
Reserves Category
|
|
|
December 2015 (MMBOE)
|
|
|
% Oil
|
|
|
December 2014 (MMBOE)
|
|
|
% Change
|
|
Colombia
|
|
|
1P
|
|
|
32.2
|
|
|
100%
|
|
|
24.7
|
|
|
+30%
|
|
|
|
|
2P
|
|
|
46.5
|
|
|
100%
|
|
|
38.6
|
|
|
+20%
|
|
|
|
|
3P
|
|
|
58.2
|
|
|
100%
|
|
|
51.2
|
|
|
+14%
|
|
Chile
|
|
|
1P
|
|
|
13.5
|
|
|
48%
|
|
|
12.3
|
|
|
+10%
|
|
|
|
|
2P
|
|
|
41.8
|
|
|
38%
|
|
|
46.2
|
|
|
-10%
|
|
|
|
|
3P
|
|
|
90.1
|
|
|
27%
|
|
|
101.9
|
|
|
-12%
|
|
Brazil
|
|
|
1P
|
|
|
6.7
|
|
|
2%
|
|
|
7.2
|
|
|
-7%
|
|
|
|
|
2P
|
|
|
6.9
|
|
|
2%
|
|
|
7.3
|
|
|
-5%
|
|
|
|
|
3P
|
|
|
7.1
|
|
|
2%
|
|
|
7.7
|
|
|
-8%
|
|
Total
|
|
|
1P
|
|
|
52.3
|
|
|
74%
|
|
|
44.2
|
|
|
+19%
|
|
(D&M Certified)
|
|
|
2P
|
|
|
95.1
|
|
|
66%
|
|
|
92.1
|
|
|
+3%
|
|
|
|
|
3P
|
|
|
155.5
|
|
|
53%
|
|
|
160.8
|
|
|
-3%
|
|
Peru1
|
|
|
1P
|
|
|
18.8
|
|
|
100%
|
|
|
18.8
|
|
|
-
|
|
|
|
|
2P
|
|
|
30.2
|
|
|
100%
|
|
|
30.2
|
|
|
-
|
|
|
|
|
3P
|
|
|
59.1
|
|
|
100%
|
|
|
60.2
|
|
|
-2%
|
|
Total (Including Peru)
|
|
|
1P
|
|
|
71.1
|
|
|
81%
|
|
|
62.9
|
|
|
+13%
|
|
(D&M Certified)
|
|
|
2P
|
|
|
125.3
|
|
|
74%
|
|
|
122.3
|
|
|
+2%
|
|
|
|
|
3P
|
|
|
214.6
|
|
|
66%
|
|
|
221.1
|
|
|
-3%
|
|
1 Transaction executed with Petroperu on October 1,
2014 with final closing subject to Peru Government approval.
|
Analysis by Business Segment
Colombia:
The table below sets forth GeoPark’s Colombian D&M certified oil
reserves by category as of December 31, 2015, as compared to the
previous year:
|
|
|
|
|
|
|
|
|
|
|
|
|
|
|
Reserves Category
|
|
|
December 2015 (MMBOE)
|
|
|
% Oil
|
|
|
December 2014 (MMBOE)
|
|
|
% Change
|
|
PDP
|
|
|
8.6
|
|
|
100%
|
|
|
7.5
|
|
|
+15%
|
|
PUD
|
|
|
23.6
|
|
|
100%
|
|
|
17.2
|
|
|
+37%
|
|
1P
|
|
|
32.2
|
|
|
100%
|
|
|
24.7
|
|
|
+30%
|
|
2P
|
|
|
46.5
|
|
|
100%
|
|
|
38.6
|
|
|
+20%
|
|
3P
|
|
|
58.2
|
|
|
100%
|
|
|
51.2
|
|
|
+14%
|
After record production of 4.8 MMBOE in 2015 (up 26% as compared to
2014), GeoPark’s 2P D&M certified reserves in Colombia increased by 20%
to 46.5 MMBOE compared to 2014. This increase is mainly the result of
net additions of 12.7 MMBOE (100% oil) of P1 reserves related to new
discoveries in 2015 including Jacana, Chachalaca and Tilo oil fields in
the Llanos 34 Block (GeoPark operated with 45% WI), partially offset by
2015 production.
The Llanos 34 Block (GeoPark operated with 45% WI), represented 90% of
GeoPark’s Colombian 2P D&M certified reserves as of December 31, 2015.
For each barrel of oil equivalent extracted in Colombia, 2.6 barrels of
P1 reserves were added, resulting in a P1 RRI of 258%. For each barrel
of oil equivalent extracted, 2.6 barrels of 2P reserves were added,
resulting in a 2P RRI of 265%.
The P1 RLI increased to 6.8 years (6.3 years in 2014) while 2P RLI
remained flat at 9.7 years in 2015 as compared to 2014.
Chile:
The table below sets forth GeoPark’s Chilean D&M certified oil and
natural gas reserves by category as of December 31, 2015, as compared to
the previous year:
|
|
|
|
|
|
|
|
|
|
|
|
|
|
|
Reserves Category
|
|
|
December 2015 (MMBOE)
|
|
|
% Oil
|
|
|
December 2014 (MMBOE)
|
|
|
% Change
|
|
PDP
|
|
|
2.0
|
|
|
36%
|
|
|
2.6
|
|
|
-23%
|
|
PUD
|
|
|
11.5
|
|
|
50%
|
|
|
9.7
|
|
|
+19%
|
|
1P
|
|
|
13.5
|
|
|
48%
|
|
|
12.3
|
|
|
+10%
|
|
2P
|
|
|
41.8
|
|
|
38%
|
|
|
46.2
|
|
|
-10%
|
|
3P
|
|
|
90.1
|
|
|
27%
|
|
|
101.9
|
|
|
-12%
|
After production of 1.4 MMBOE in 2015, GeoPark’s 2P reserves in Chile
decreased by 10% to 41.8 MMBOE compared to 2014, mainly due to a 4.7
MMBOE reserve reduction in the Fell Block (GeoPark operated with a 100%
WI) due to technical revisions and the impact of lower oil prices on
some small marginal fields.
The Fell Block (GeoPark operated with a 100% WI) represented 99% of
GeoPark’s Chilean 2P D&M certified reserves and consisted of 38% oil and
62% gas.
For each barrel of oil equivalent extracted in Chile, 1.9 barrels of P1
reserves were added, resulting in a P1 RRI of 186%. The 2P RRI is
negative resulting from the reserve revision.
The P1 RLI increased to 9.6 years (compared to 5.3 years in 2014).
Brazil:
The table below sets forth GeoPark’s Brazilian D&M certified oil and
natural gas reserves by category as of December 31, 2015, as compared to
the previous year:
|
|
|
|
|
|
|
|
|
|
|
|
|
|
|
Reserves Category
|
|
|
December 2015 (MMBOE)
|
|
|
% Oil
|
|
|
December 2014 (MMBOE)
|
|
|
% Change
|
|
PDP
|
|
|
6.7
|
|
|
2%
|
|
|
3.7
|
|
|
+81%
|
|
PUD
|
|
|
0.0
|
|
|
2%
|
|
|
3.5
|
|
|
-100%
|
|
1P
|
|
|
6.7
|
|
|
2%
|
|
|
7.2
|
|
|
-7%
|
|
2P
|
|
|
6.9
|
|
|
2%
|
|
|
7.3
|
|
|
-5%
|
|
3P
|
|
|
7.1
|
|
|
2%
|
|
|
7.7
|
|
|
-8%
|
PDP D&M certified reserves in Brazil increased by 81% (3 MMBOE) to 6.7
MMBOE, resulting from the installation and tie-in of the gas compression
plant for the Manati gas field. For each BOE produced in 2015
(production of 1.2 MMBOE), 3.5 BOE of PDP reserves were added with PDP
RRI of 350%.
2P D&M certified reserves decreased 0.4 MMBOE, or by 5%, to 6.9 MMBOE
compared to 2014.
PDP RLI increased to 5.6 years (vs 2.8 in 2014) while 2P RLI slightly
increased to approximately 5.7 years from 5.5 in 2014.
The Manati Field (GeoPark non-operated with a 10% WI) represented 100%
of GeoParks’ Brazilian D&M certified reserves and consisted 98% on gas.
Peru:
In October 2014, GeoPark executed an agreement with Petróleos del Perú
S.A. (“Petroperu”) to acquire an interest in and operate the Morona
Block located in northern Peru covering an area of 1.9 million acres in
the Marañón Basin. The transaction is currently pending approval from
the Peruvian Government.
The Morona Block (to be operated by GeoPark with a 75% WI) contains the
Situche Central oil field, which has been delineated by two wells tests
(of approximately 2,400 and 5,200 bopd oil each) and by 3D seismic.
The table below sets forth GeoPark’s Peruvian D&M certified net oil
reserves by category as of December 31, 2015:
|
|
|
|
|
|
|
|
|
|
|
|
|
|
|
Reserves Category
|
|
|
December 2015 (MMBOE)
|
|
|
% Oil
|
|
|
December 2014 (MMBOE)
|
|
|
% Change
|
|
PDNP
|
|
|
6.8
|
|
|
100%
|
|
|
6.6
|
|
|
-
|
|
PUD
|
|
|
12.0
|
|
|
100%
|
|
|
12.2
|
|
|
-
|
|
1P
|
|
|
18.8
|
|
|
100%
|
|
|
18.8
|
|
|
-
|
|
2P
|
|
|
30.2
|
|
|
100%
|
|
|
30.2
|
|
|
-
|
|
3P
|
|
|
59.1
|
|
|
100%
|
|
|
60.2
|
|
|
-2%
|
D&M Certified Reserves Change by Country
The following table shows the net change in 2P D&M certified reserves by
country from December 31, 2014 to December 31, 2015:
|
|
|
|
|
|
|
|
|
|
|
|
|
|
|
|
|
|
|
|
|
(MMBOE)
|
|
|
Colombia
|
|
|
Chile
|
|
|
Brazil
|
|
|
Total
|
|
|
Peru
|
|
|
Total
Incl.
Peru
|
|
2P Reserves as of December 31, 2014
|
|
|
38.6
|
|
|
46.2
|
|
|
7.3
|
|
|
92.1
|
|
|
30.2
|
|
|
122.3
|
|
Production 2014
|
|
|
-4.8
|
|
|
-1.4
|
|
|
-1.2
|
|
|
-7.4
|
|
|
0.0
|
|
|
-7.4
|
|
Net Additions
|
|
|
12.7
|
|
|
-3.0
|
|
|
0.8
|
|
|
10.4
|
|
|
0.0
|
|
|
10.4
|
|
Acquisitions
|
|
|
0.0
|
|
|
0.0
|
|
|
0.0
|
|
|
0.0
|
|
|
0.0
|
|
|
0.0
|
|
2P Reserves as of December 31, 2015
|
|
|
46.5
|
|
|
41.8
|
|
|
6.9
|
|
|
95.1
|
|
|
30.2
|
|
|
125.3
|
D&M Certified Reserve Net Present Value Summary
The table below sets forth GeoPark’s net present value after tax by
country and by category of certified reserves as of December 31, 2015,
as compared to the previous year:
|
|
|
|
|
|
|
|
|
|
|
|
|
|
|
Country
|
|
|
Reserves Category
|
|
|
NPV10 2015
($ MM)
|
|
|
NPV10 2014
($ MM)
|
|
|
% Change
|
|
Colombia
|
|
|
1P
|
|
|
447
|
|
|
408
|
|
|
+10%
|
|
|
|
|
2P
|
|
|
655
|
|
|
640
|
|
|
+2%
|
|
|
|
|
3P
|
|
|
839
|
|
|
842
|
|
|
0%
|
|
Chile
|
|
|
1P
|
|
|
142
|
|
|
121
|
|
|
+17%
|
|
|
|
|
2P
|
|
|
478
|
|
|
579
|
|
|
-17%
|
|
|
|
|
3P
|
|
|
1,040
|
|
|
1,165
|
|
|
-11%
|
|
Brazil
|
|
|
1P
|
|
|
84
|
|
|
115
|
|
|
-27%
|
|
|
|
|
2P
|
|
|
87
|
|
|
118
|
|
|
-26%
|
|
|
|
|
3P
|
|
|
92
|
|
|
120
|
|
|
-23%
|
|
Total
|
|
|
1P
|
|
|
674
|
|
|
644
|
|
|
+5%
|
|
(D&M Certified)
|
|
|
2P
|
|
|
1,221
|
|
|
1,337
|
|
|
-9%
|
|
|
|
|
3P
|
|
|
1,970
|
|
|
2,127
|
|
|
-7%
|
|
Peru
|
|
|
1P
|
|
|
217
|
|
|
149
|
|
|
+46%
|
|
|
|
|
2P
|
|
|
425
|
|
|
354
|
|
|
+20%
|
|
|
|
|
3P
|
|
|
936
|
|
|
877
|
|
|
+7%
|
|
Total (Including Peru)
|
|
|
1P
|
|
|
891
|
|
|
792
|
|
|
+13%
|
|
(D&M Certified)
|
|
|
2P
|
|
|
1,646
|
|
|
1,690
|
|
|
-3%
|
|
|
|
|
3P
|
|
|
2,906
|
|
|
3,004
|
|
|
-3%
|
Price Forecast (comparison 2015 vs 2014):
The pricing assumptions used in estimating feasibility of PRMS reserves
and net present values in 2015 and 2014 are set forth in the table below:
|
|
|
|
|
|
|
|
|
|
|
|
|
|
|
|
|
|
|
|
|
Oil Price
|
|
2015
|
|
2016
|
|
2017
|
|
2018
|
|
2019
|
|
2020
|
|
2021
|
|
2022
|
|
2023 and thereafter
|
|
WTI ($/bbl) – 2015 Reserves Report
|
|
-
|
|
40
|
|
50
|
|
60
|
|
70
|
|
80
|
|
90
|
|
100
|
|
100
|
|
WTI ($/bbl) – 2014 Reserves Report
|
|
50
|
|
60
|
|
67
|
|
75
|
|
85
|
|
95
|
|
100
|
|
100
|
|
100
|
GLOSSARY
|
|
1P
|
|
|
|
|
Proved Reserves
|
|
|
2P
|
|
|
|
|
Proved plus Probable Reserves
|
|
|
3P
|
|
|
|
|
Proved plus Probable plus Possible Reserves
|
|
|
BOE
|
|
|
|
|
Barrels of oil equivalent (6,000 cf gas per bbl of oil equivalent)
|
|
|
BOEPD
|
|
|
|
|
Barrels of oil equivalent per day
|
|
|
BOPD
|
|
|
|
|
Barrels of oil per day
|
|
|
Certified Reserves
|
|
|
|
|
Refers to net reserves independently evaluated by the petroleum
consulting firm, DeGolyer and MacNaughton
|
|
|
MBOED
|
|
|
|
|
Thousands of Barrels of oil equivalent per day
|
|
|
MMBOED
|
|
|
|
|
Millions of Barrels of oil equivalent per day
|
|
|
MMbbl
|
|
|
|
|
Millions of Barrels of oil
|
|
|
MCFPD
|
|
|
|
|
Thousands of standard cubic feet per day
|
|
|
MMCFPD
|
|
|
|
|
Millions of standard cubic feet per day
|
|
|
PDNP
|
|
|
|
|
Proved Developed Non-Producing Reserves
|
|
|
PDP
|
|
|
|
|
Proved Developed Producing Reserves
|
|
|
PUD
|
|
|
|
|
Proved Undeveloped Reserves
|
|
|
sqkm
|
|
|
|
|
Square kilometers
|
|
|
WI
|
|
|
|
|
Working Interest
|
Notice
Additional information about GeoPark can be found in the “Investor
Support” section of the website at www.geo-park.com
The reserve estimates provided in this release are estimates only, and
there is no guarantee that the estimated reserves will be recovered.
Actual reserves may eventually prove to be greater than, or less than,
the estimates provided herein. Statements relating to reserves are by
their nature forward-looking statements.
Rounding amounts and percentages: Certain amounts and percentages
included in this press release have been rounded for ease of
presentation. Percentage figures included in this press release have not
in all cases been calculated on the basis of such rounded figures, but
on the basis of such amounts prior to rounding. For this reason, certain
percentage amounts in this press release may vary from those obtained by
performing the same calculations using the figures in the financial
statements. In addition, certain other amounts that appear in this press
release may not sum due to rounding.
Oil and gas production figures included in this release are stated
before the effect of royalties paid in kind, consumption and losses.
Cautionary Statements Relevant to Forward-Looking Information
This press release contains statements that constitute forward-looking
statements. Many of the forward looking statements contained in this
press release can be identified by the use of forward-looking words such
as ‘‘anticipate,’’ ‘‘believe’’, ‘‘could,’’ ‘‘expect,’’ ‘‘should,’’
‘‘plan,’’ ‘‘intend,’’ ‘‘will,’’ ‘‘estimate’’ and ‘‘potential,’’ among
others.
Forward-looking statements that appear in a number of places in this
press release include, but are not limited to, statements regarding the
intent, belief or current expectations, regarding various matters.
Forward-looking statements are based on management’s beliefs and
assumptions, and on information currently available to the management.
Such statements are subject to risks and uncertainties, and actual
results may differ materially from those expressed or implied in the
forward-looking statements due to various factors.
Forward-looking statements speak only as of the date they are made, and
the Company does not undertake any obligation to update them in light of
new information or future developments or to release publicly any
revisions to these statements in order to reflect later events or
circumstances, or to reflect the occurrence of unanticipated events. For
a discussion of the risks facing the Company which could affect whether
these forward-looking statements are realized, see the Company’s filings
with the U.S. Securities and Exchange Commission.
1 Transaction executed with Petroperu on October 1, 2014 with
final closing subject to Peru Government approval.

View source version on businesswire.com: http://www.businesswire.com/news/home/20160229006904/en/
Copyright Business Wire 2016


