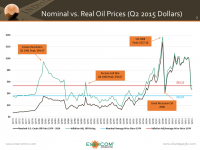
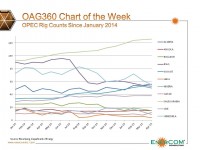
WTI Price Increasingly Unstable Since OPEC 2014 Decision
The price of U.S. benchmark WTI crude is becoming increasingly volatile
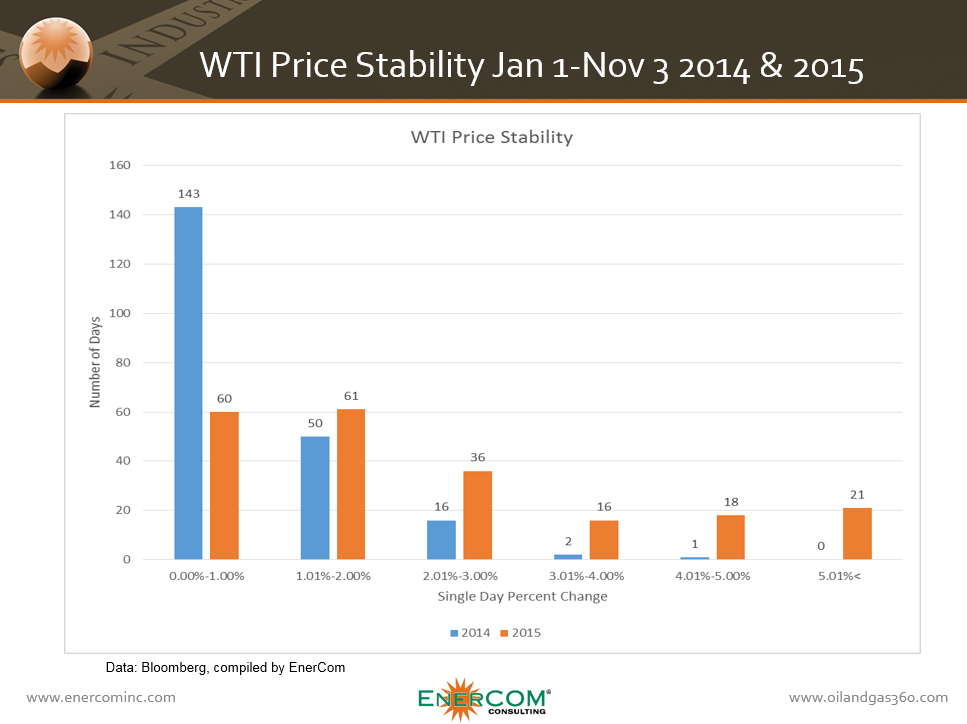
The price of U.S. crude oil benchmark West Texas Intermediate (WTI) has been increasingly volatile since November of last year, following the decision by OPEC to maintain production over …