Natural gas has come a long way since the Chinese first transported it in 500 B.C. through bamboo shoots to boil sea water, and make drinkable.
Nowadays, natural gas is the world’s fastest growing fossil fuel, with global consumption expected to jump from 113.0 trillion cubic feet (Tcf) in 2010 to 185.0 Tcf in 2040. The United States, already believed to be the world’s leading natural gas producer, is at the forefront of supplying the anticipated 64% increase in global demand. The Energy Information Association (EIA) believes the U.S. will become a net exporter of the resource by 2020, and produce approximately 37.5 Tcf by 2040 (approximately20% of the world’s consumption). The U.S. is predicted to consume 29.5 Tcf in the same year, equaling approximately 80% of its production.
Africa, South America and North America all recorded above-average growth rates in 2012, according to a consumption report by BP. The United States increased its consumption rates by 4.1%. Natural gas use also increased in Asia, with China (9.9%) and Japan (10.3%) registering the greatest increases. OECD consumption grew more rapidly than non-OECD consumption for the first time since 2000.
2012 Natural Gas Consumption per Capita (Tons of Oil Equivalent)

While its abundance and efficiency is replacing popular fuels like diesel and coal in electricity generation and transportation, the fuel’s oversupply has put the squeeze on natural gas prices. As of January 8, 2014, crude oil prices were trading 21.2 times greater than natural gas prices, as compared to the the energy equivalent ratio of 6 to 1.
Energy Equivalent Pricing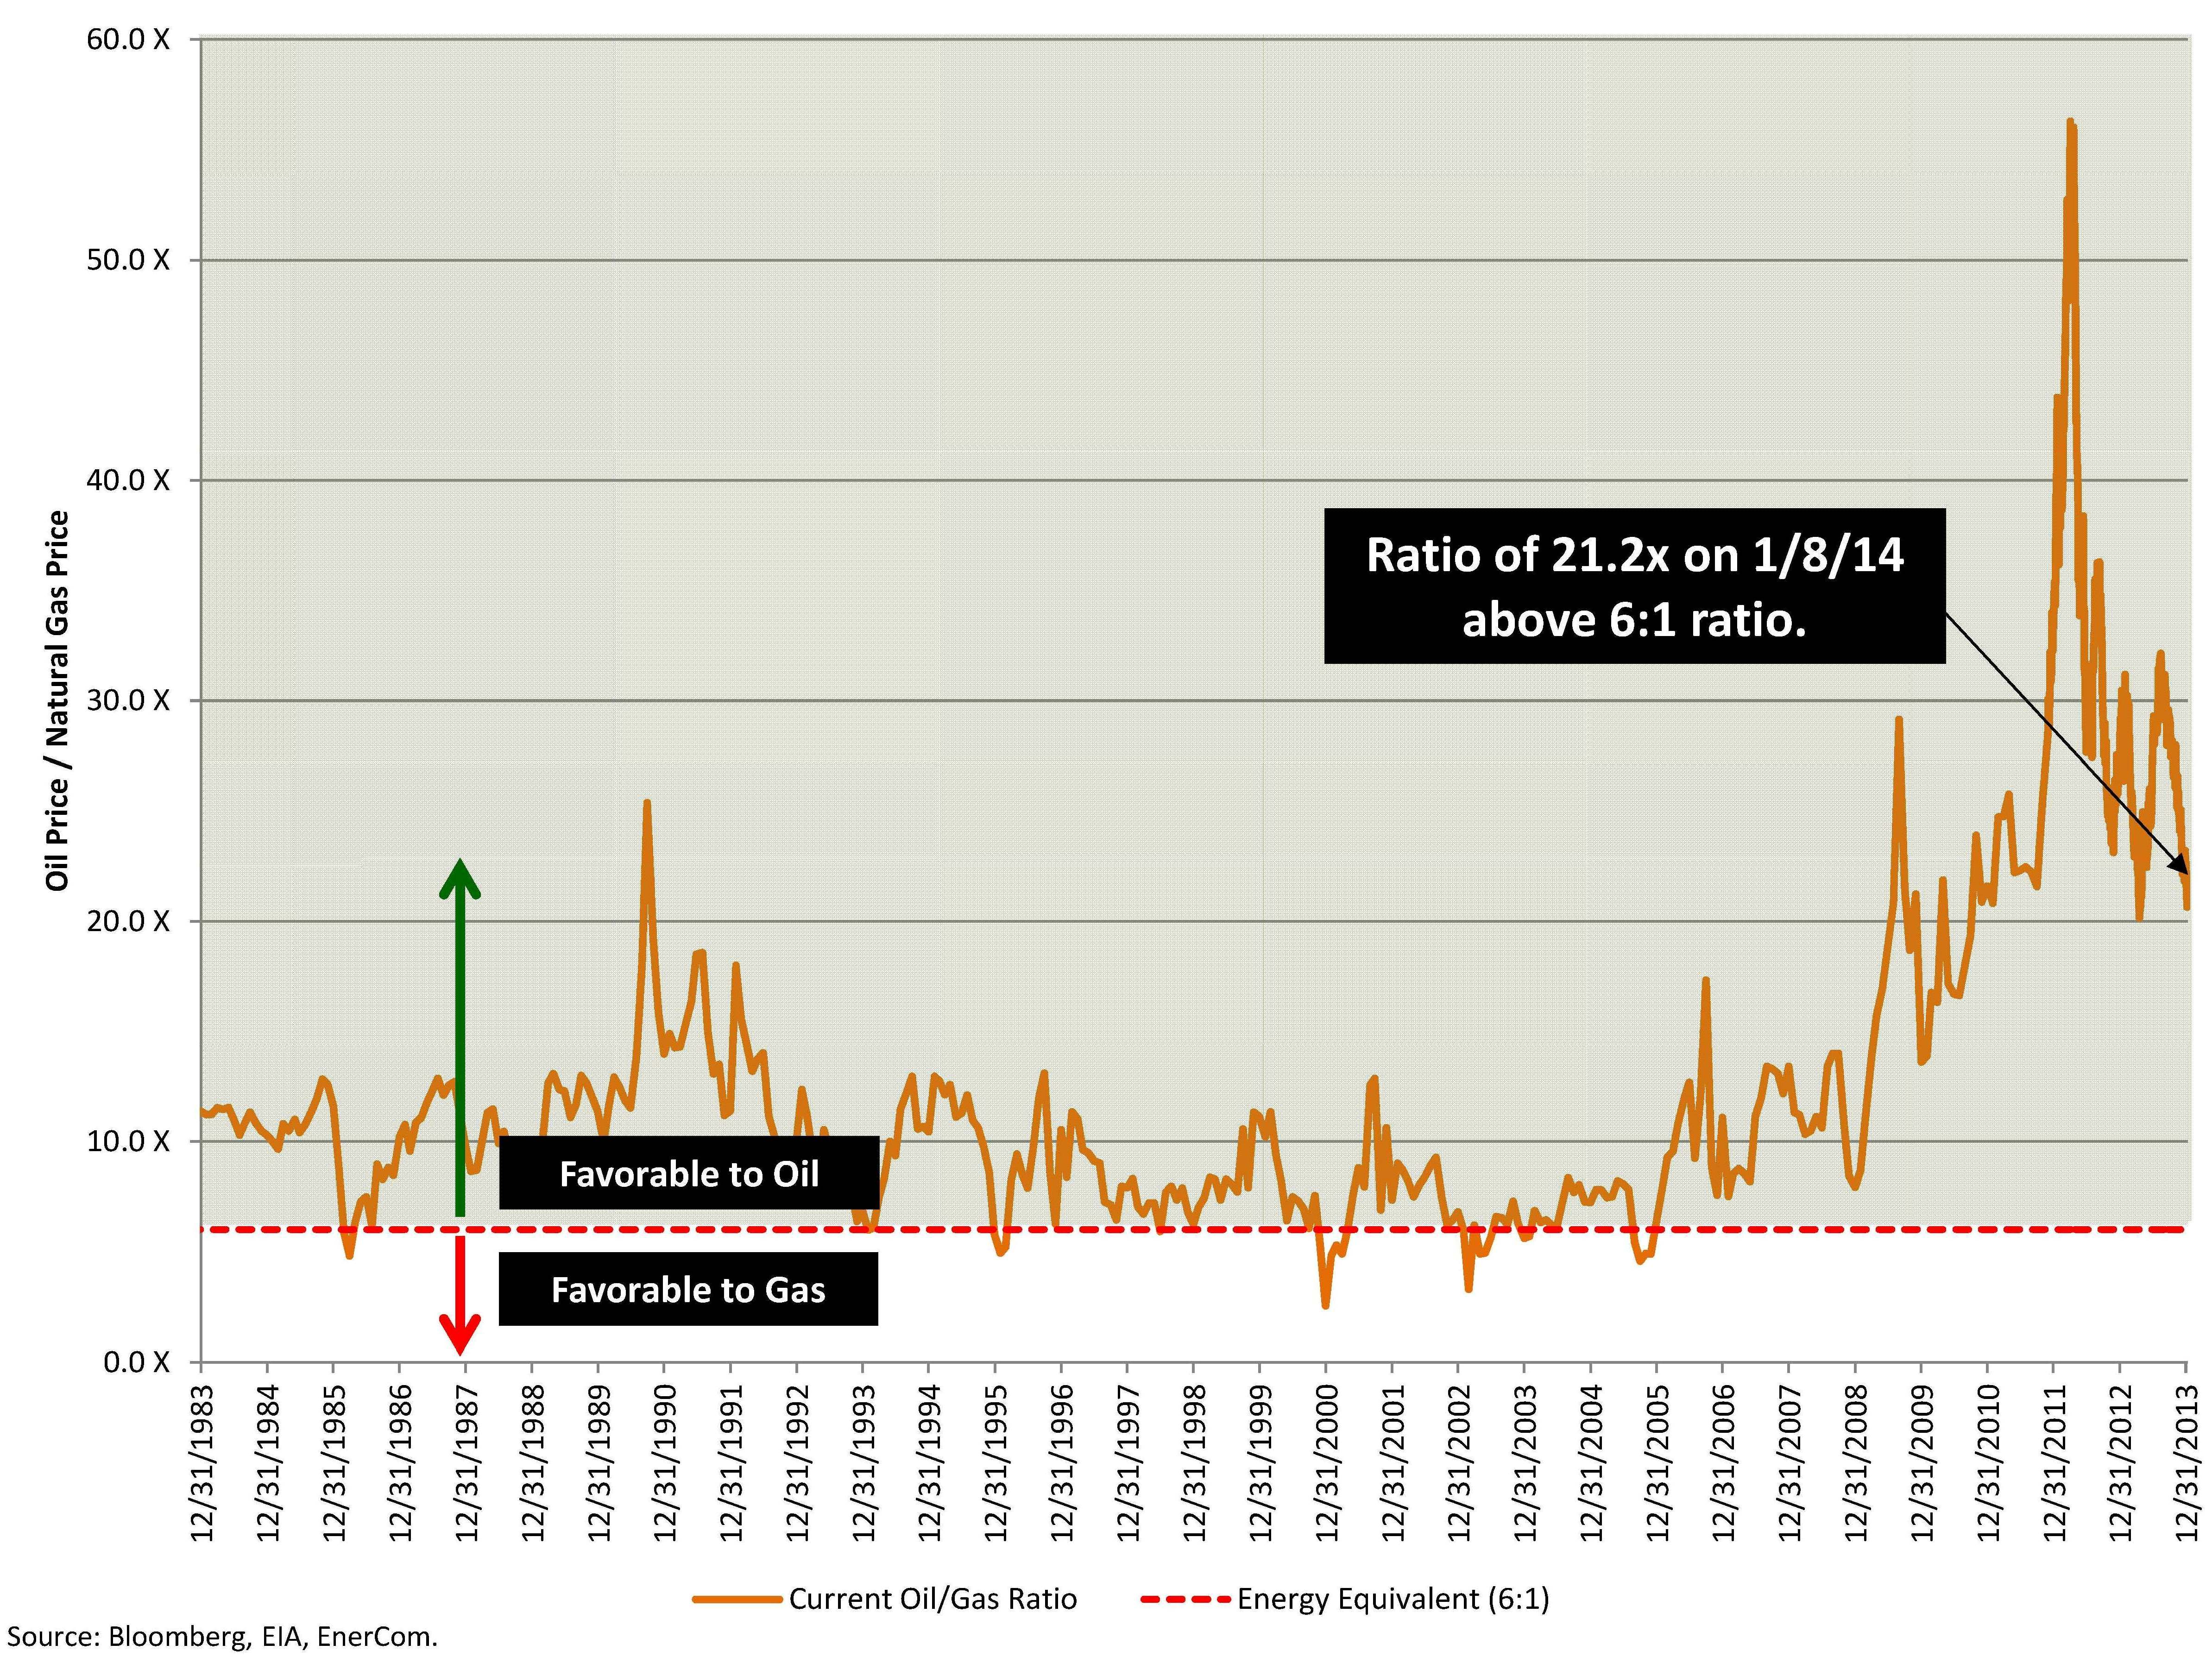
The United States is pursuing new demand creation strategies such as LNG exports, coal to natural gas electricity generation switching, and CNG/LNG transportation opportunities to help burn off the tremendous supply gut created by the industry.
In the following write-up, Oil & Gas 360® will provide you a snapshot of the current natural gas landscape and where we could go from here.
How Did We Get to this Point?
You can’t know where you’re going until you know where you’ve been. Just six years ago, in 2008, the United States produced approximately 50 Bcf/d and imported more than three Bcf/d. Today, with the advent of horizontal drilling, exploitation of the shale plays and technology, the country is producing more than 65 Bcf/d and importing virtually no LNG.
U.S. LNG Imports (Jan-99 to Oct-13)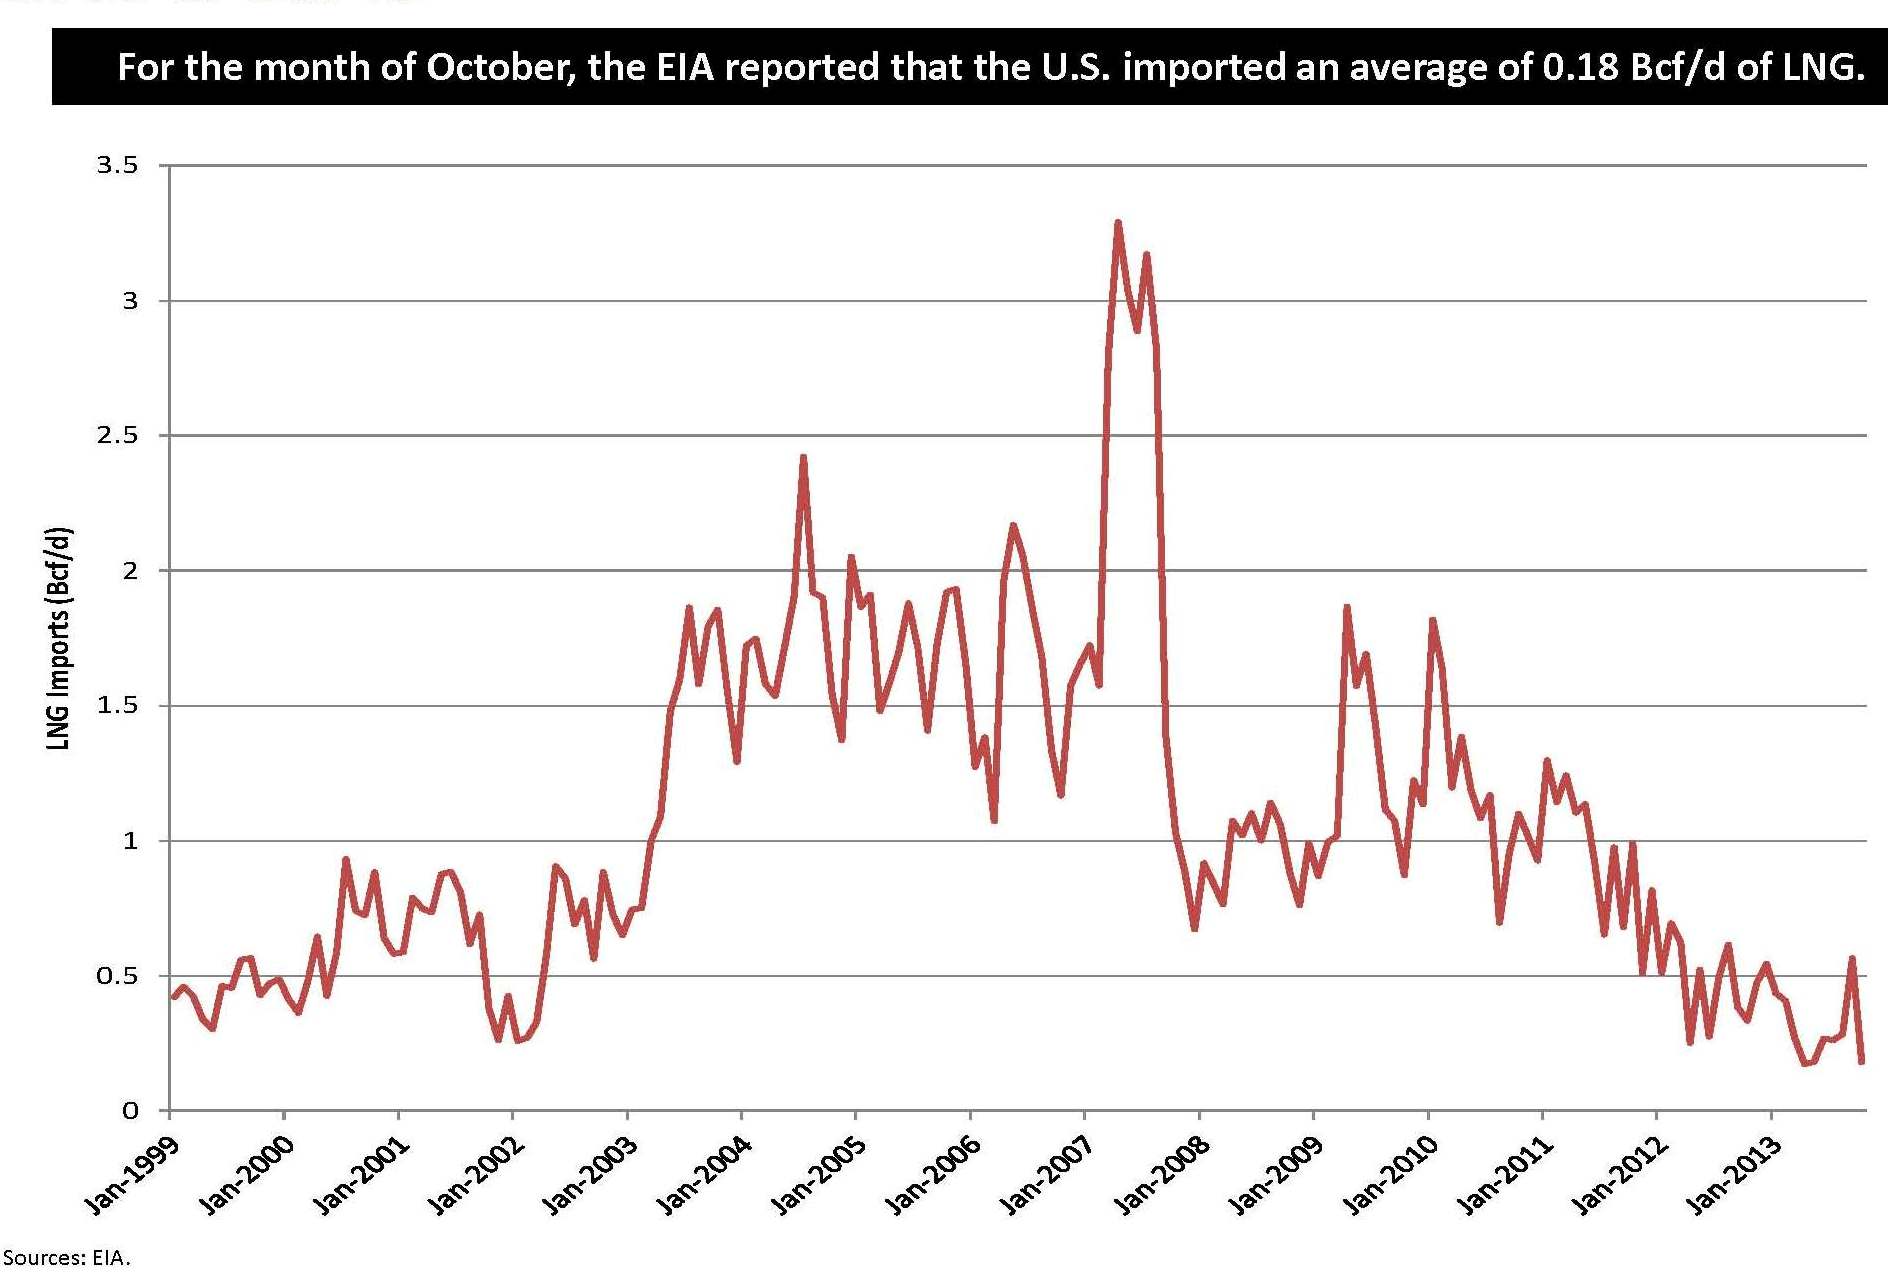
Unconventional techniques, such as horizontal drilling and fracturing, were experimented in the Barnett shale throughout the 1990s. The technique was a surprising success, and shale gas production through the new methods skyrocketed. Peter C. Evans and Michael F. Farina of General Electric wrote in The Age of Gas & the Power of Networks that U.S.-based unconventional gas accounted for 55% of the country’s gas supply in 2012, an increase of 223% year-over-year from 1999, when it represented just 1.6%.
Horizontal drilling now accounts for roughly 62% of active rigs in the U.S. The technique is expected to remain consistent, as increased knowledge and technological advancements have led to lower production costs and higher efficiency. The average horizontal well is now being completed in 20 days, which is 75% faster than 2011’s average rate.
U.S. Horizontal Rig Count as a % of Total Land Rig Count

The shale boom thrust the United States to become the world’s largest gas producer. Its production, Combined with Canada, U.S. production makes up 25% of global supply. Its estimated producible reserves are more than 2,500 Tcf, which translates to 100 years of available domestic gas supply if future consumption rates prove to be accurate. This is in stark contrast to reports in 1980, when recoverable resources were estimated to be roughly one-third of current estimates.
Sectors Burning Up the Gas Flow – New Demand Sources
 Electricity Generation. The authors of The Age of Gas & the Power of Networks believe the power sector is expected to pace future demand. The consistency and reliability of gas supply allows it to adjust to fluctuating energy demands and can serve as a backup to solar and wind technology depending on the weather. The amount of gas intended for use as electricity is expected to expand by as much as 50%.
The effectiveness of converting gas to electricity is also increasing. The latest power cycle plants using the method are achieving thermal efficiencies of 61%, while combined heat and power systems are reaching efficiencies higher than 80%. The versatility of gas allows it to be used for both large or small projects, and the cost of installing the technology on location is 67% cheaper than a coal plant and 80% cheaper than a nuclear plant.
Natural Gas Vehicles. A major piece of the consumer market is the role of transportation. Gasoline/diesel has historically accounted for almost all of public transit, but LNG-fueled vehicles are starting to make an impact. LNG is a much cheaper and environmentally-friendly than diesel, but the problem with expanding the market is its current lack of infrastructure. The market and support regarding natural gas vehicles is gaining traction, and sales for the vehicles have risen an average of 15% per year since 2008. Much of the growth has occurred in emerging markets, including Iran, Pakistan, China, India, Brazil and Argentina. The Age of Gas & the Power of Networks anticipates the use of such vehicles to increase between 6% and 8% annually for the foreseeable future. Gas-powered vehicles currently account for just 1% of the world’s fleet, so the room for growth is significant.
World LNG Estimated November 2013 Landed Prices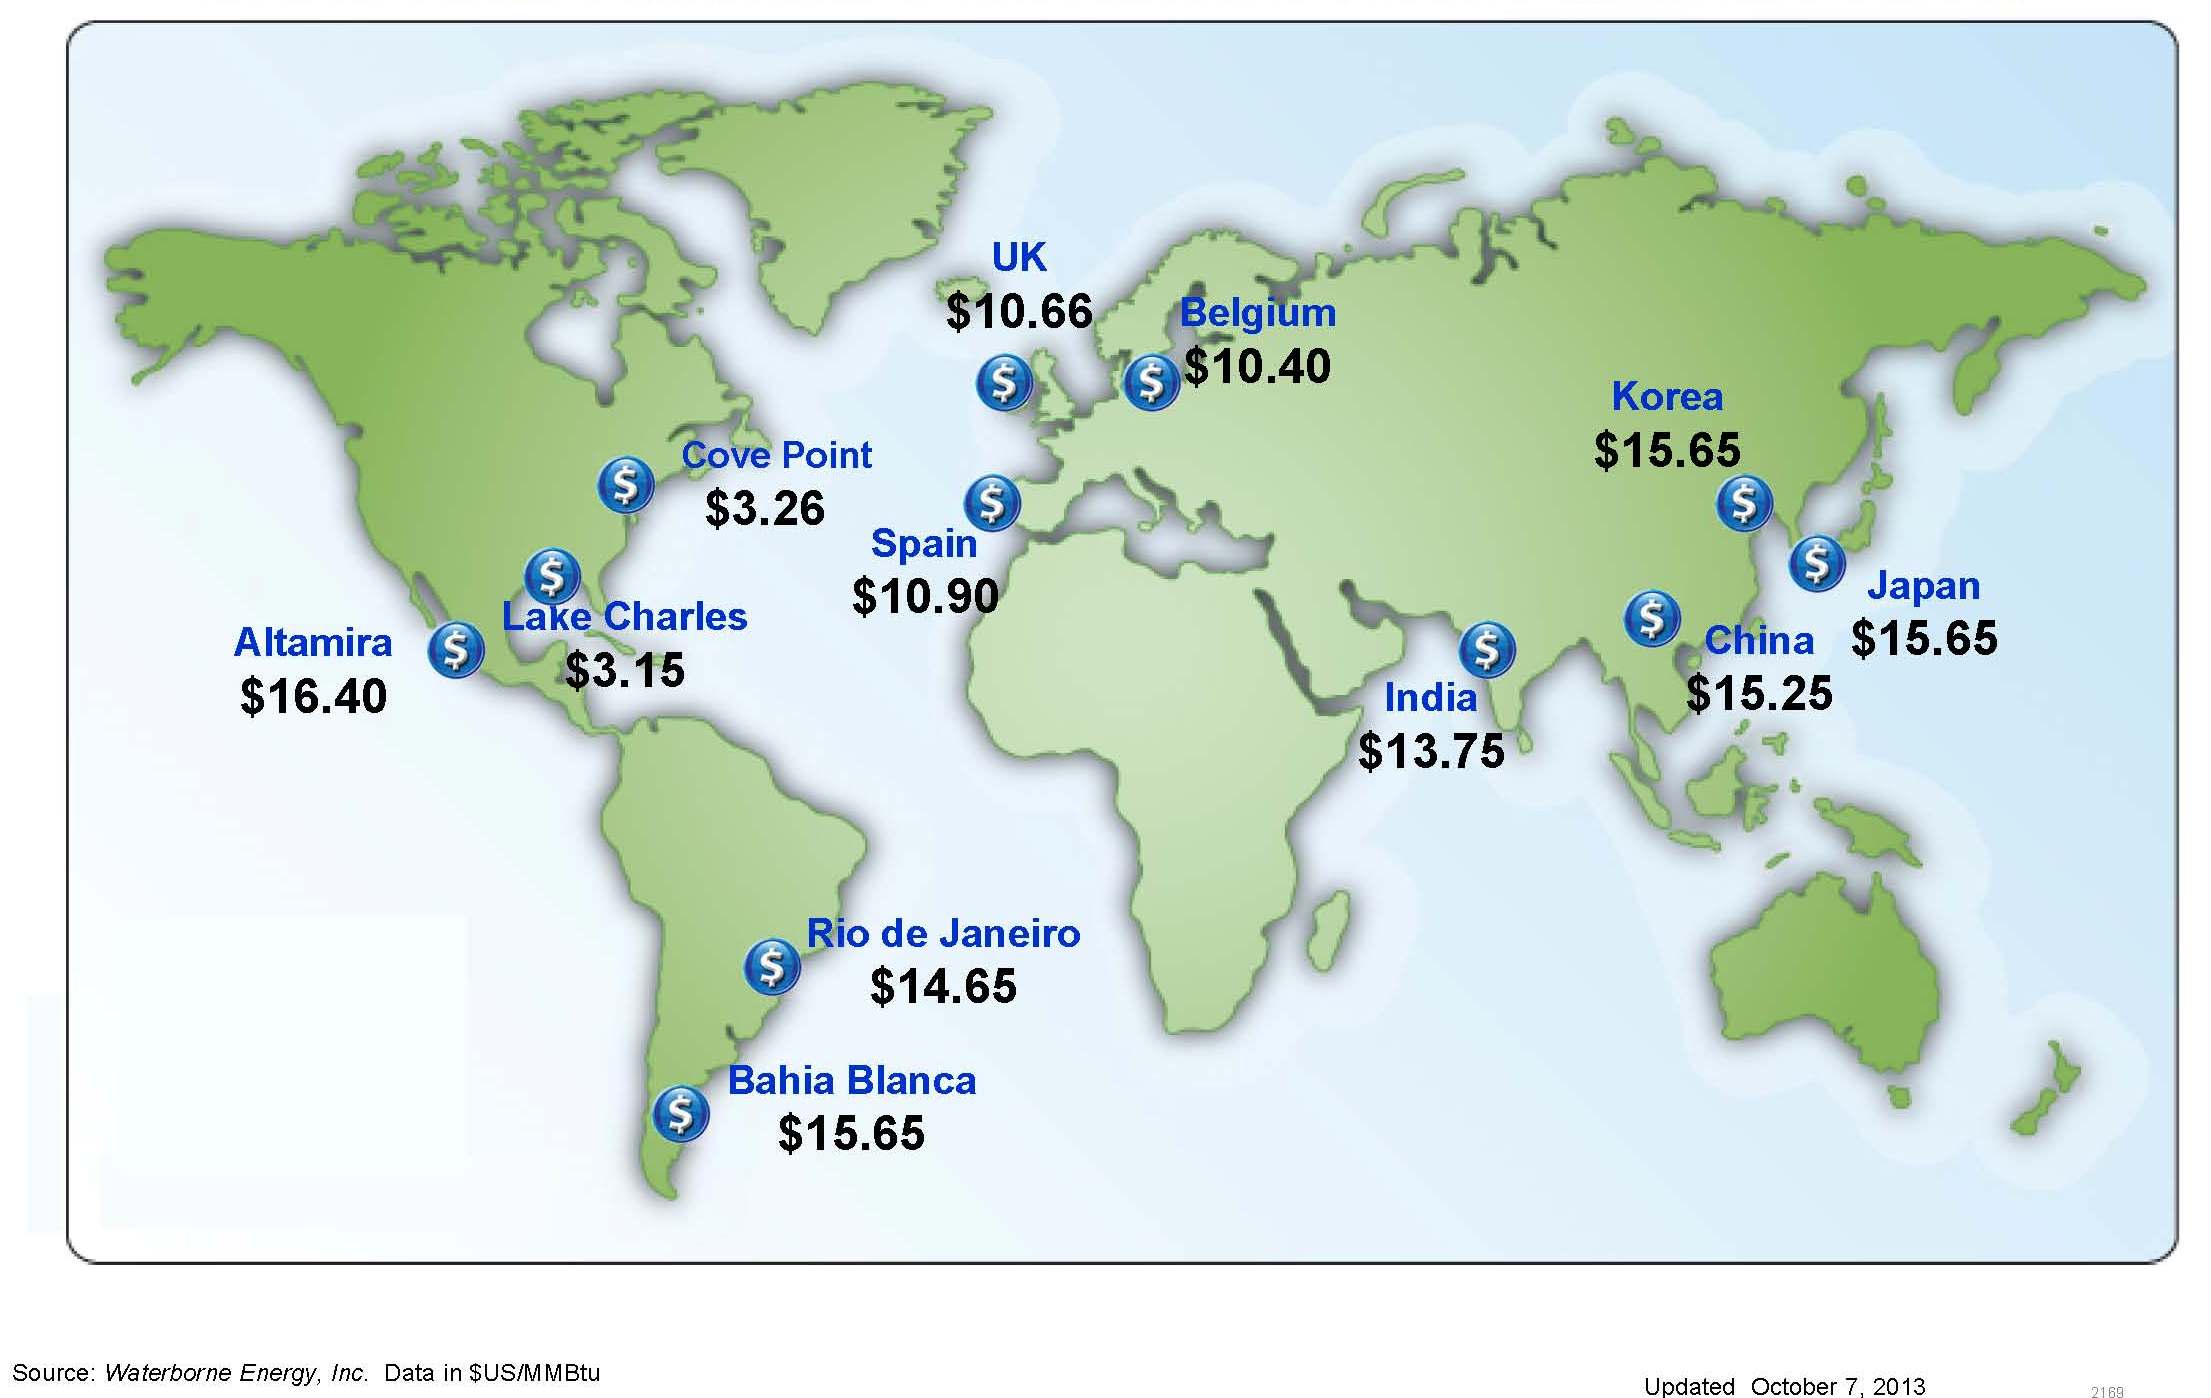
LNG Exports. The 327 billion cubic meters (Bcm) of global LNG imports in 2012 double the 140 Bcm imported in 2000. The amount of importing countries is predicted to reach 42 by 2020 while the number of exporting countries will remain consistent, with the U.S. and Australia becoming more prominent exporters. At the LNG 17 conference in Houston in April 2013, Daniel Yergin said he projected U.S. natural gas could reach Asian markets at a price of $12.00 per MMBtu – still much cheaper than LNG currently being bought by Japan at approximately $16.00 per MMBtu. According to the Department of Energy, five LNG terminals are being built in the United States and will provide an additional 8.0 Bcf/d to the global LNG market. An additional 31 projects have either been submitted or are under review.
U.S. LNG Terminals under Construction
 Southeast Asia in particular has considerable demand for gas due to its glaring energy needs and recent problems with carbon emissions. China’s coal exploitation is almost single-handedly driving up the world’s emissions and a nuclear fallout stemming from the Fukushima disaster in Japan has neighboring countries scrambling for cleaner, safer energy options. Even the U.S. is considering implementing very strict environmental standards on its coal industry, which is estimated to emit roughly twice as much carbon as natural gas. The EIA predicts China’s coal use to decline starting in 2030, leaving the possibility of natural gas filling the void.
Natural Gas Prices – Where Art Thou (Going)?
We will turn our attention on prices from the rear view mirror to looking forward out the windshield and into the future. EnerCom’s short‐term natural gas forecast model provides some insight into where natural gas prices are likely to go over the next several months. The EnerCom model uses a variety of leading indicators proven to be predictive for forecasting near‐term, directional moves in natural gas prices.
The chart below compares the actual price for near‐month natural gas futures, or NG1 (red line), to the EnerCom forecast (blue diamonds). At January 8, 2014, the EnerCom forecast model suggested that the current market for NG1 is overbought. Our model forecasts that the price of NG1 will decline to a market clearing price of approximately $4.00 per Mcf by the first part of March and will then drift lower to $3.50 through the summer.
EnerCom Natural Gas Price Forecast Model (January 8, 2014)
 Looking backwards at commodity prices gives us some insight into the imminent round of year‐end earnings and reserves announcements. No matter what the direction of prices however, there is no better friend to value creation than finding new demand sources.
Global demand in 2012 reached 123 Tcf/year (equivalent to roughly 23 MMBO), or roughly 70% the size of the global oil market, and currently contributes about 24% of the overall primary energy supply. The EIA says natural gas consumption in the United States alone will increase by 21% by the year 2040, according to its 2013 Annual Energy Outlook. Global demand is predicted to rise 56% from 2010 to 2040. Worldwide, natural gas consumption for electric power generation increases by nearly 80% from 2010 to 2040, while natural gas consumption in the industrial sector increases by 58%. Those two sectors account for 77% of the net increase in global natural gas use over the projection period.
In conclusion, while gas can be seen as a rival to other fossil fuels, many believe gas will become complementary to renewable energy as the industry continues to evolve. Looking ahead, the future seems bright and plentiful for the global natural gas market.
[sam_ad id=”32″ codes=”true”]
Important disclosures: The information provided herein is believed to be reliable; however, EnerCom, Inc. makes no representation or warranty as to its completeness or accuracy. EnerCom’s conclusions are based upon information gathered from sources deemed to be reliable. This note is not intended as an offer or solicitation for the purchase or sale of any security or financial instrument of any company mentioned in this note. This note was prepared for general circulation and does not provide investment recommendations specific to individual investors. All readers of the note must make their own investment decisions based upon their specific investment objectives and financial situation utilizing their own financial advisors as they deem necessary. Investors should consider a company’s entire financial and operational structure in making any investment decisions. Past performance of any company discussed in this note should not be taken as an indication or guarantee of future results. EnerCom is a multi-disciplined management consulting services firm that regularly intends to seek business, or currently may be undertaking business, with companies covered on Oil & Gas 360®, and thereby seeks to receive compensation from these companies for its services. In addition, EnerCom, or its principals or employees, may have an economic interest in any of these companies. As a result, readers of EnerCom’s Oil & Gas 360® should be aware that the firm may have a conflict of interest that could affect the objectivity of this note. The company or companies covered in this note did not review the note prior to publication. EnerCom, or its principals or employees, may have an economic interest in any of the companies covered in this report or on Oil & Gas 360®. As a result, readers of EnerCom’s reports or Oil & Gas 360® should be aware that the firm may have a conflict of interest that could affect the objectivity of this report.