Wells Fargo NGL Snapshot Examines U.S. Supply, Demand, and Fractionation Capacity
With the arrival in Norway of the first ethane shipment from Enterprise Products Partners’ terminal in Morgan’s Point, Texas on September 22, Oil & Gas 360® took a look into the current state of the U.S. natural gas liquids market, as outlined in Wells Fargo’s September NGL Snapshot.
May ’16 NGL Supply and Demand Higher Y-O-Y
Total U.S. NGL supply averaged 4,509,000 Bbls/day in May 2016, representing a 10.6% increase from the prior year. NGL production from natural gas processing accounted for 82% of NGL supply while imports and refinery outputs accounted for 3% and 15%, respectively, as shown in the chart below.

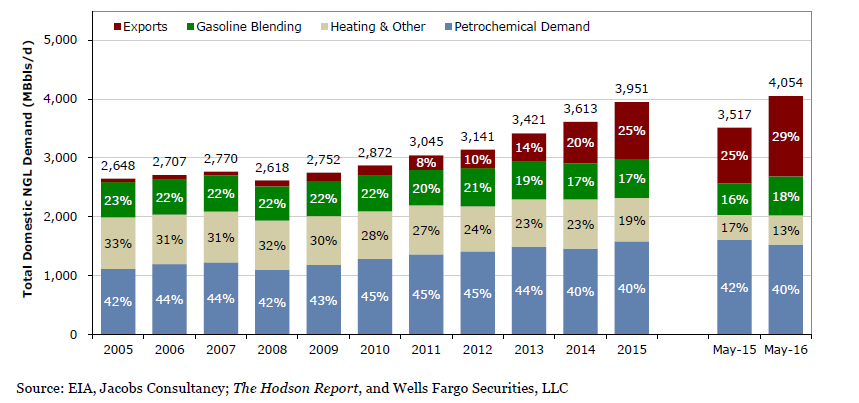
NGL demand increased to 4,054,000 Bbls/d, a 15.3% increase from the prior year. Most of the increase was attributable to higher exports (414,000 Bbls/d), which currently account for 29% of demand. 40% of demand was driven by the petrochemical industry, which uses NGLs as feedstock in steam crackers to produce ethylene and other products. 18% goes to gasoline blending and the remaining 13% is used for heating and fuel (primarily propane).
Petrochemical demand for light feeds (ethane, propane, and butane) remains high at 93.8% of the overall steam cracker feed slate, above the five-year average of 89.9%. Many companies have retooled existing facilities to accept additional NGL feedstock, given its relative cost advantage. July ethylene production decreased 3.4% from the prior year to 56.7 million lbs. The average steam cracker operating rate was 91.7%, which is slightly above the 91% five-year average.
NGL Composition Lighter per Barrel
NGL fractionation facilities process mixed NGL streams to extract pure NGL products, including ethane, propane, normal butane, isobutane and natural gasoline. The average mix of a barrel of NGLs produced in May was split 38% ethane, 32% propane, 9% normal butane, 9% iso-butane, and 12% natural gasoline (pentanes). For comparison, the standard breakdown of the same components used in pricing a Mont Belvieu NGL barrel is 37%, 32%, 11%, 6%, and 12% . The table below from the September Snapshot shows the mix of NGLs in the field production mix as of May 2016.

In recent years, the NGL mix has shifted towards the lighter end of the barrel due to higher ethane content being produced from unconventional development. In many shale plays, ethane can compose more than 50% of produced NGLs. Increased levels of “rejected” ethane, which is left in the natural gas pipeline stream and not marketed, has resulted in a lower proportion of ethane per NGL barrel in the past few years, according to Wells Fargo. Whether ethane is rejected or recovered depends on current prices, demand, and availability of facilities to remove it.
Due to its higher heat content than methane, increased ethane rejection into a natural gas stream is indicated by higher overall heat content of the stream. According to the EIA, heat content has decreased since the beginning of 2016 in states receiving gas from Marcellus and Utica production. This indicates that producers are increasingly extracting ethane and coincides with the start of ethane exports from Marcus Hook, Pennsylvania.
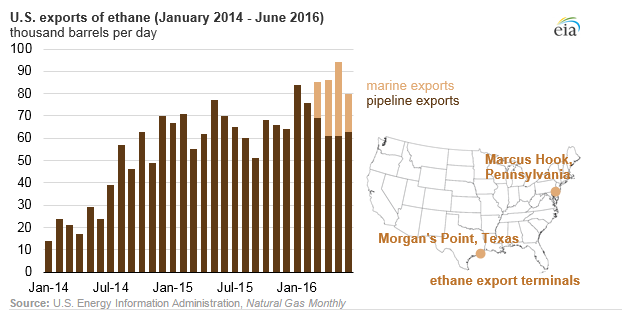
Ethane Exports on the Rise
Higher U.S. ethane production has resulted in increased ethane exports both by pipeline to Canada and by tanker overseas. Both the 35,000 Bbl/day Marcus Hook terminal near Philadelphia, which will provide an outlet for Marcellus and Utica NGLs, and the 200,000 Bbl/day Morgan’s Point terminal in Houston are the U.S’s first ethane export terminals and will help U.S. gas producers such as Range Resources find more favorable NGL pricing in international markets.
Excess Fractionation Capacity Supports Future Ethane Recovery for Steam Crackers
A total of 5.2 MMBbls/day of NGL fractionation capacity is believed to exist across the U.S, with 60% located in Mont Belvieu and Louisiana. Fractionation expansions are expected to be small in the next two years after the period of 2011 through 2016 saw capacity increase 82%.
Wells Fargo estimates that the average utilization rate of fractionation assets was lower than average at 78% in H1 2016, due to new capacity and ethane rejection. The report further notes that with about 1.7 MMBbls/day of excess capacity, “ethane will be able to be quickly recovered out of the gas stream when new crackers are placed into service (2018-2019 time frame) without the need for large-scale fractionation expansions.”


