The Federal Reserve Bank of Dallas reported that wages in the Permian Basin fell for the second quarter in a row after spiking in first quarter 2017. The rig count and crude oil production rose in January, the Fed said.
Wages
Average weekly wages fell 0.3% in the Permian Basin, while wages fell by almost 1% statewide between second quarter 2017 and third quarter 2017. The Permian Basin’s decline was led by Midland’s drop of 0.6%.
The average weekly wage in the Permian during third quarter 2017 was over $1,200—about 15% more than the Texas average. This is likely because of the larger share of energy jobs in this area relative to the state’s job market, the Fed said.
Energy – continued oil production streak and improved rig count
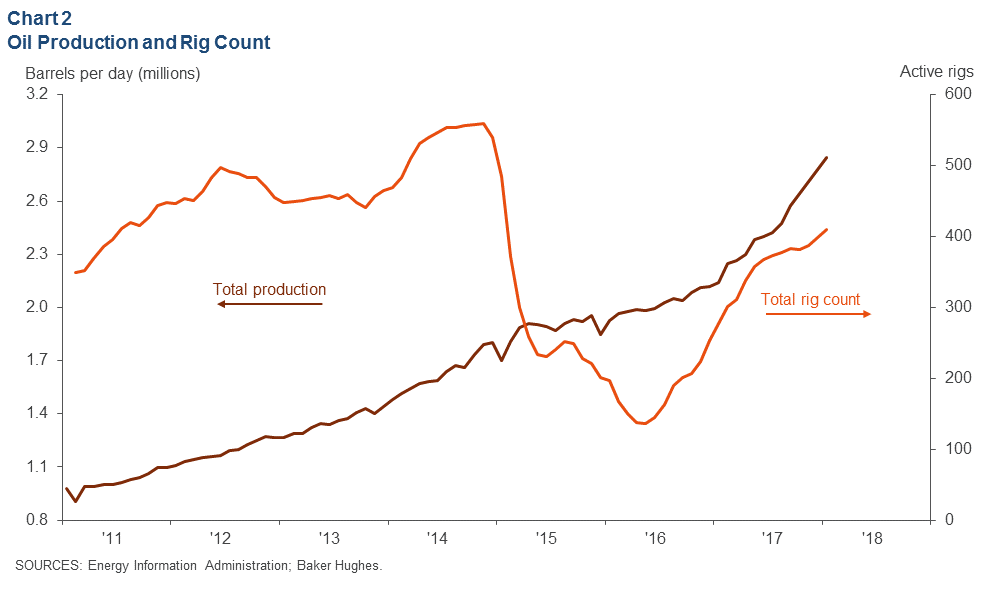
The Permian Basin’s rig count rose to 410 rigs in January 2018—an increase of 12 rigs from the prior month and the highest since January 2015, the Fed said.
Permian Basin production grew to 2.85 MMBOPD in January—an increase of 69,000 BOPD from December. Production has increased by around 70,000 BOPD every month since October 2017, and the EIA expects the trend to continue in February.
The EIA recently raised its forecast for 2018 U.S. crude oil production to an average of 10.6 MMBOPD. This would break the record of 9.6 MMBOPD set in 1970.
DUCs on the rise
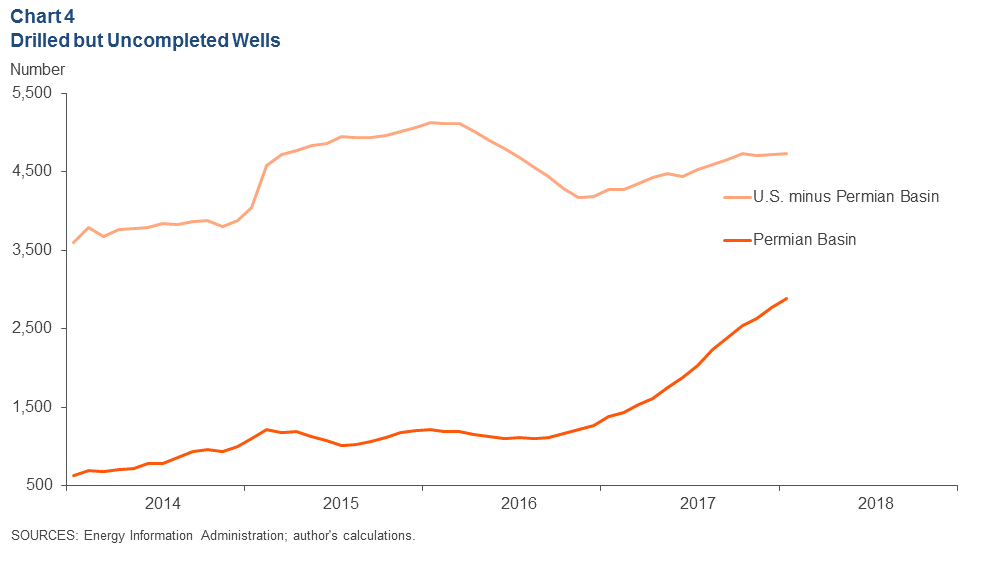
The number DUCs increased by 4% in the Permian Basin between December 2017 and January 2018, while the rest of the U.S. basins’ DUC count only increased slightly, the Fed said. The Permian’s DUC count has more than doubled from January 2016 to January 2017, while the rest of the U.S. basins’ counts only rose 11%.


