On January 12, Core Laboratories N.V. (ticker: CLB) announced that it would increase the cash dividend on its common shares to $0.55 per share. The dividend represents a 10% increase and will be payable on February 20, 2015, to shareholders of record January 23, 2015.
With operations in 50 countries — essentially working in every major oil-producing province in the world — Core Lab is a leading provider of proprietary and patented reservoir description, production enhancement, and reservoir management services used to optimize petroleum reservoir performance. Reservoir optimization technologies enable oil and gas operators to maximize hydrocarbon recovery from producing fields.
Driven by sales of new or recently introduced technologies within Core’s Reservoir Description and Production Enhancement operations, Core reported its most profitable quarter ever in Q3’14, earning net income of $67.9 million, or $1.53 per diluted share.
Shareholder Capital Return Program in Full Force
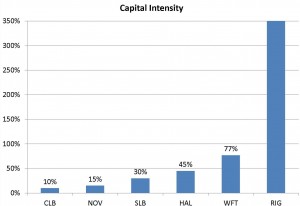
Core’s low capital intensity, defined as trailing twelve month capital expenditures divided by trailing twelve month EBITDA, is one factor that put the company in position to increase its dividend, a tenant of its Shareholder Capital Return Program. The program includes reducing the number of shares outstanding through buybacks, issuing special dividends, as well as regular quarterly dividends. The company declared its first dividend in July 2008.
Since instituting its Shareholder Capital Return Program more than 12 years ago, Core has reduced its diluted share count by over 39,000,000 and has returned almost $1.94 billion to its shareholders as of third quarter ended September 30, 2014. Subsequently, Core has announced repurchases of 383,253 shares, at an average cost of $128.86 per share, thereby returning an additional $49,384,329.89 to shareholders. This leaves a remaining outstanding diluted share count of approximately 43,413,000 putting it at a level below the number of shares outstanding in its IPO on NASDAQ in 1995.
Return On Invested Capital and Capital Intensity Tops OilService Sector
According to EnerCom Inc.’s OilService Weekly Report, the energy consulting firm’s proprietary financial analysis of 87 public companies in the oilfield services sector, Core Lab’s capital intensity is 10% and its return on invested capital (ROIC) is 83%, top decile marks for both ratios versus its peers. Capital intensity is the amount of cash flow a company generates for every $1 of capital investment. CLB generates $1 of cash flow for every $0.10 of capital investment.
OAG360 does not believe the company will be announcing a cut in capital spending, as its annual investment is customer-directed on projects that are focused on achieving the highest and best production rate for a customer’s well and field.
Return on invested capital measures trailing twelve month EBITDA divided by total equity plus net debt. Core’s ROIC ratio is the best of any company in EnerCom’s OilService database, exceeding that of, Baker Hughes (ticker: BHI), Halliburton (ticker: HAL), National Oilwell Varco (ticker: NOV), Schlumberger (ticker: SLB), Transocean (ticker: RIG) and Weatherford International (ticker: WFT).
Free Cash Flow Tops All Major OilService Companies
Core Labs’ ability to issue dividends and buy back stock is facilitated by the company’s ability to generate free cash flow (FCF). In Q3’14, Core Lab’s free cash flow reached $66.6 million, up 2% from the year-earlier third quarter, turning 89.47% of net cash provided by operating activities into free cash flow. According to company data, this level of FCF represents the highest percentage of all major oilfield service companies.
Fourth Quarter 2014 Guidance
In spite of recent crude oil price weakness and continued softness in the near-term worldwide deepwater environment, Core says it expects fourth quarter results to be up from third quarter levels. Core expects revenue between $275 million and $280 million with earnings per share between $1.53 and $1.56 for 4Q of 2014 .
The company expects operating margins in 4Q’14 to be approximately 33%, and it expects to exit the year at 34%. This would put Core’s year-over-year incremental margins as high as 60%. At the same time Core Labs expects FCF to be between $72 million and $77 million for the final quarter of 2014.
Important disclosures: The information provided herein is believed to be reliable; however, EnerCom, Inc. makes no representation or warranty as to its completeness or accuracy. EnerCom’s conclusions are based upon information gathered from sources deemed to be reliable. This note is not intended as an offer or solicitation for the purchase or sale of any security or financial instrument of any company mentioned in this note. This note was prepared for general circulation and does not provide investment recommendations specific to individual investors. All readers of the note must make their own investment decisions based upon their specific investment objectives and financial situation utilizing their own financial advisors as they deem necessary. Investors should consider a company’s entire financial and operational structure in making any investment decisions. Past performance of any company discussed in this note should not be taken as an indication or guarantee of future results. EnerCom is a multi-disciplined management consulting services firm that regularly intends to seek business, or currently may be undertaking business, with companies covered on Oil & Gas 360®, and thereby seeks to receive compensation from these companies for its services. In addition, EnerCom, or its principals or employees, may have an economic interest in any of these companies. As a result, readers of EnerCom’s Oil & Gas 360® should be aware that the firm may have a conflict of interest that could affect the objectivity of this note. The company or companies covered in this note did not review the note prior to publication. EnerCom, or its principals or employees, may have an economic interest in any of the companies covered in this report or on Oil & Gas 360®. As a result, readers of EnerCom’s reports or Oil & Gas 360® should be aware that the firm may have a conflict of interest that could affect the objectivity of this report.


