Permian oil producers continue to tout enviable half-cycle metrics, but what does the complete picture show?
The mad dash of capital into the Permian’s Delaware sub-basin over the last two years has been awe-inspiring considering the backdrop of oil prices careening down to half their 2014 highs, with $45-$52 oil turning into a new normal.
Oil and gas companies throughout the country have had to scale back and put a heavy emphasis on efficiency to survive the downturn, but that hasn’t stopped an influx of capital into the Delaware that has sent land prices through the roof along with the price-to-cash flow multiples of the companies operating in the region.
Investors continued to look for strong returns in the low-oil price environment, and the stacked pay and impressive well results in the Delaware are prime to deliver on those expectations.
Companies continue to tout EURs in excess of 1 MMBOE and margins for which investors are willing to pay a premium. Looking at a peer group of Delaware players, it becomes clear why operators are willing to spend so much to get a foothold in the country’s hottest basin.
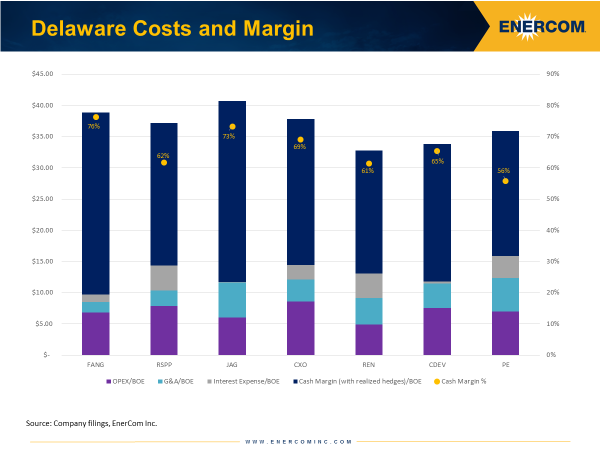
Cash margins for the group (with realized hedges) average 66% based on the group’s second-quarter results. Even Resolute (ticker: REN), which in the September report had lower metrics due to its Aneth assets, is showing cash margins greater than 60% based on the expected LOE costs of its Delaware assets. These are impressive results, and investors have been willing to pay for them, but half-cycle results (those that exclude F&D) only tell half the story.
Investors are beginning to look at full-cycle margins for the full picture
During our August conference, we began to hear an increasing number of investors voice concern that, while impressive, the half-cycle returns reported by companies were not giving them an accurate picture of the companies’ operations. Demand for Permian assets has sent acreage costs sharply higher, and without including the entry cost for their position, companies are not giving the full picture of the cost of each barrel they produce.
Adding in F&D costs for the same peer group, the average cash margin per BOE produced drops to just 15%. Centennial Resource Development’s margin disappears altogether, but the company is projecting rapid production increase with year-end output at 5.8 MBOEPD and guidance to 60 MBOEPD by the end of the decade.
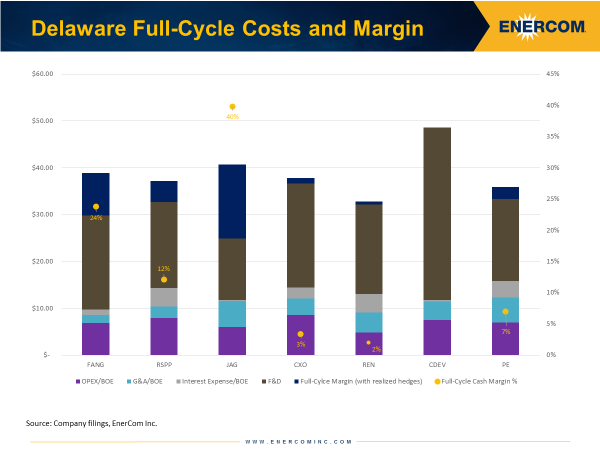
The high price of entry has taken a bit out of companies’ margins, and investors are beginning to look to companies to honestly display the costs associated with operations in the Delaware. Half-cycle results paint a pretty picture, but adding in F&D makes operations in the area appear a little less rosy.
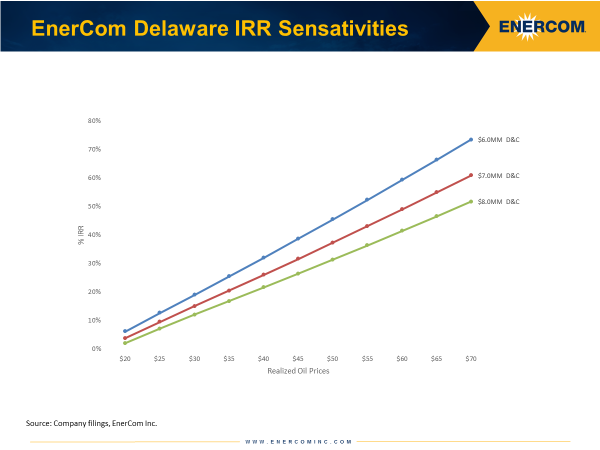
Wells in the Delaware still display strong economics
Even though the addition of finding and development costs paints a picture operators are less keen to present to markets, their assets do continue to show impressive results. Wells in the Delaware average approximately $7.3 million based on presentations from companies in the region. Those wells have an average estimated ultimate recovery of approximately 1.2 MMBOE, most of which (average 73%) is liquids. With those metrics, an $8 million well returns 22% IRRs at $40 WTI, giving credence to the economics operators in the region report.
Also supporting E&P companies’ claims that the region remains one of the most desirable in the country is the fact that future development costs are expected to fall considerably as operators focus capital on drilling wells as opposed to buying acreage. Current F&D costs for the Delaware peer group examined by EnerCom was $21.03 per BOE, but future development costs for the group is $9.72 per BOE. The 54% decrease in F&D costs will go a long way in improving full-cycle margins for Delaware players, but based on conversations EnerCom has had with the buy-side, investors are increasingly focused on the total cost of development, and not just the rosy half-cycle picture.