|
Southwestern Energy Announces 2017 Operational And Financial Results
HOUSTON, March 1, 2018 /PRNewswire/ -- Southwestern Energy Company (NYSE: SWN) today announced its financial and operating results for the fourth quarter and the year ended December 31, 2017. The Company met or exceeded its guidance and delivered on each of its commitments in the fourth quarter. Fiscal year 2017 highlights include:
- Net cash provided by operating activities of $1,097 million and net cash flow of $1,138 million, an increase of approximately 120% and 76%, respectively compared to 2016;
- Net income attributable to common stock of $815 million, or $1.63 per diluted share, and adjusted net income attributable to common stock of $219 million, or $0.44 per diluted share;
- Total net production of 897 Bcfe, including 578 Bcfe from the Appalachian Basin and 316 Bcf from the Fayetteville Shale
- Comprised of 89% natural gas and 11% NGLs and condensate;
- Record Appalachian Basin gross operated exit rate production of 2.35 Bcfe per day, a 40% increase compared to December 2016;
- Realized C3+ NGL prices of $30.08 per barrel, or 59% of West Texas Intermediate (WTI), and realized total NGL prices of $14.48 per barrel, or 28% of WTI (net of transportation costs), up 69% and 94%, respectively, compared to 2016;
- Record total proved reserves of approximately 14.8 Tcfe, including 11.1 Tcfe from the Appalachian Basin, up 181% and 393%, respectively, compared to 2016
- Comprised of 75% natural gas and 25% NGLs and condensate at year-end 2017, compared to 93% and 7% in 2016, respectively;
- 46% proved undeveloped at year-end 2017
- Reserve life index increased to more than 16 years at year-end 2017, an increase of approximately 175% compared to year-end 2016;
- Increase in pre-tax PV10 reserve value to approximately $5.8 billion, up 247% compared to year-end 2016, including $3.8 billion from the Appalachian Basin;
- Proved Developed (PD) Finding and Development (F&D) costs for the total company of $0.72 per Mcfe, 4% better than 2016 and demonstrating continued improved capital efficiency; and
- Further optimized drilling and completion techniques resulting in increased type curves and improved economics in the Appalachian Basin.
"Southwestern Energy delivered solid financial and operational results in 2017. There is clear evidence of upside in our assets, as the value of our PV10 reserves alone is well above current enterprise value," said Bill Way, President and Chief Executive Officer. "Our focus in 2018 will be on exploring strategic alternatives for Fayetteville Shale assets, accelerating development in Appalachia and reducing structural costs as we reposition the Company to compete and win in any commodity price environment for years to come. Building on the momentum from our leading technical and operational expertise and our demonstrated financial discipline, underpinned by our Formula that guides everything we do, we are well positioned to drive increasing value for our shareholders."
The Company invested within cash flow (supplemented by the previously announced remaining $200 million from its 2016 equity offering as planned) while investing in its highest return projects. Below is a summary of fourth quarter and full year 2017 results.
|
Financial Results
|
For the three months ended
|
|
For the year ended
|
|
December 31,
|
|
December 31,
|
|
2017
|
|
2016
|
|
2017
|
|
2016
|
|
(in millions, except per share amounts)
|
|
|
|
|
|
|
|
|
|
|
|
|
Operating income (loss)
|
$
|
167
|
|
$
|
122
|
|
$
|
731
|
|
$
|
(2,195)
|
|
Adjusted operating income (non-GAAP measure)
|
$
|
169
|
|
$
|
134
|
|
$
|
735
|
|
$
|
215
|
|
|
|
|
|
|
|
|
|
|
|
|
|
Net income (loss) attributable to common stock
|
$
|
267
|
|
$
|
(237)
|
|
$
|
815
|
|
$
|
(2,751)
|
|
Adjusted net income (loss) attributable to common stock (non-GAAP measure)
|
$
|
63
|
|
$
|
39
|
|
$
|
219
|
|
$
|
(7)
|
|
|
|
|
|
|
|
|
|
|
|
|
|
Diluted earnings (loss) per share
|
$
|
0.53
|
|
$
|
(0.48)
|
|
$
|
1.63
|
|
$
|
(6.32)
|
|
Adjusted diluted earnings (loss) per share (non-GAAP measure)
|
$
|
0.12
|
|
$
|
0.08
|
|
$
|
0.44
|
|
$
|
(0.01)
|
|
|
|
|
|
|
|
|
|
|
|
|
|
Net cash provided by operating activities
|
$
|
308
|
|
$
|
161
|
|
$
|
1,097
|
|
$
|
498
|
|
Net cash flow (non-GAAP measure)
|
$
|
322
|
|
$
|
211
|
|
$
|
1,138
|
|
$
|
645
|
|
Exploration and Production Financial Results
|
For the three months ended
|
|
For the year ended
|
|
December 31,
|
|
December 31,
|
|
2017
|
|
2016
|
|
2017
|
|
2016
|
|
Production
|
|
|
|
|
|
|
|
|
|
|
|
|
Fayetteville (Bcf)
|
|
75
|
|
|
86
|
|
|
316
|
|
|
375
|
|
Northeast Appalachia (Bcf)
|
|
110
|
|
|
82
|
|
|
395
|
|
|
350
|
|
Southwest Appalachia (Bcfe)
|
|
52
|
|
|
33
|
|
|
183
|
|
|
148
|
|
Other (Bcfe)
|
|
2
|
|
|
1
|
|
|
3
|
|
|
2
|
|
Total production (Bcfe)
|
|
239
|
|
|
202
|
|
|
897
|
|
|
875
|
|
% Natural Gas
|
|
88%
|
|
|
90%
|
|
|
89%
|
|
|
90%
|
|
|
|
|
|
|
|
|
|
|
|
|
|
Average unit costs per Mcfe
|
|
|
|
|
|
|
|
|
|
|
|
|
Lease operating expenses
|
$
|
0.91
|
|
$
|
0.87
|
|
$
|
0.90
|
|
$
|
0.87
|
|
General & administrative expenses(1)
|
$
|
0.22
|
|
$
|
0.27
|
|
$
|
0.22
|
|
$
|
0.22
|
|
Taxes, other than income taxes(2)
|
$
|
0.07
|
|
$
|
0.11
|
|
$
|
0.10
|
|
$
|
0.10
|
|
Full cost pool amortization
|
$
|
0.48
|
|
$
|
0.30
|
|
$
|
0.45
|
|
$
|
0.38
|
|
|
|
(1)
|
Excludes legal settlements for the year ended December 31, 2017 and restructuring and other one-time charges for the three months and year ended December 31, 2016, respectively.
|
|
(2)
|
Excludes restructuring charges for the year ended December 31, 2016.
|
|
Realized Prices
|
For the three months ended
|
|
For the year ended
|
|
December 31,
|
|
December 31,
|
|
2017
|
|
2016
|
|
2017
|
|
2016
|
|
Natural Gas Price:
|
|
|
|
|
|
|
|
|
|
|
|
|
NYMEX Henry Hub Price ($/MMBtu)(1)
|
$
|
2.93
|
|
$
|
2.98
|
|
$
|
3.11
|
|
$
|
2.46
|
|
Discount to NYMEX(2)
|
|
(0.93)
|
|
|
(0.98)
|
|
|
(0.88)
|
|
|
(0.87)
|
|
Average realized gas price per Mcf, excluding hedges
|
$
|
2.00
|
|
$
|
2.00
|
|
$
|
2.23
|
|
$
|
1.59
|
|
Gain (loss) on settled financial basis derivatives ($/Mcf)
|
|
0.07
|
|
|
0.09
|
|
|
(0.01)
|
|
|
0.03
|
|
Gain (loss) on settled commodity derivatives ($/Mcf)
|
|
0.05
|
|
|
(0.02)
|
|
|
(0.03)
|
|
|
0.02
|
|
Average realized gas price per Mcf, including hedges
|
$
|
2.12
|
|
$
|
2.07
|
|
$
|
2.19
|
|
$
|
1.64
|
|
|
|
|
|
|
|
|
|
|
|
|
|
Oil Price:
|
|
|
|
|
|
|
|
|
|
|
|
|
WTI oil price ($/Bbl)
|
$
|
55.40
|
|
$
|
49.29
|
|
$
|
50.96
|
|
$
|
43.32
|
|
Discount to WTI
|
|
(7.35)
|
|
|
(8.11)
|
|
|
(7.84)
|
|
|
(12.12)
|
|
Average oil price per Bbl
|
$
|
48.05
|
|
$
|
41.18
|
|
$
|
43.12
|
|
$
|
31.20
|
|
|
|
|
|
|
|
|
|
|
|
|
|
NGL Price:
|
|
|
|
|
|
|
|
|
|
|
|
|
Average net realized NGL price per Bbl(3)
|
$
|
17.98
|
|
$
|
12.08
|
|
$
|
14.48
|
|
$
|
7.46
|
|
Percentage of WTI
|
|
32%
|
|
|
25%
|
|
|
28%
|
|
|
17%
|
|
|
|
|
|
|
|
|
|
|
|
|
|
Average net realized C3+ NGL price per Bbl
|
$
|
39.38
|
|
$
|
27.91
|
|
$
|
30.08
|
|
$
|
17.75
|
|
Percentage of WTI
|
|
71%
|
|
|
57%
|
|
|
59%
|
|
|
41%
|
|
|
|
(1)
|
Based on last day settlement prices from monthly futures contracts.
|
|
(2)
|
This discount includes a basis differential, physical basis sales, third-party transportation charges and fuel charges and excludes financial basis hedges.
|
|
(3)
|
Includes the impact of transportation costs and $0.01 per Bbl and $0.02 per Bbl of realized hedge gains for the three and twelve months ended December 31, 2017.
|
Fourth Quarter 2017 Financial Results
E&P Segment –Operating income for the segment improved to $114 million for the fourth quarter of 2017, compared to operating income of $82 million during the fourth quarter of 2016. The increase in operating income was primarily due to higher production and liquids pricing, partially offset by higher operating costs.
Midstream Segment – Operating income for the segment, comprised of gathering and marketing activities, was $54 million for the fourth quarter of 2017, compared to $40 million for the same period in 2016. The increase in operating income was primarily a result of $14 million minimum volume commitment shortfall payment from a third-party customer to the Company's gathering segment and increase in the Company's marketing margin. The increase was offset by a decrease in volumes gathered resulting from lower production volumes in the Fayetteville Shale.
Full Year 2017 Financial Results
E&P Segment – Operating income for the segment improved to $549 million for 2017, compared to an operating loss of approximately $2.4 billion for 2016, which was primarily due to the $2.3 billion impairment of natural gas and oil properties and $75 million in restructuring charges during this period last year. The increase in operating income in 2017 was primarily due to the absence of impairments and restructuring charges and higher realized natural gas and liquids pricing.
Midstream Segment – Operating income for the segment, comprised of gathering and marketing activities, was $183 million for 2017, which included a $6 million gain on sale of equipment, compared to $209 million for the same period in 2016, which included $3 million in restructuring charges. The decrease in operating income was largely due to a decrease in volumes gathered resulting from lower production volumes in the Fayetteville Shale.
Capital Structure and Investments – At December 31, 2017, the Company had total debt of approximately $4.4 billion and cash and cash equivalents of $916 million, resulting in net debt of $3.5 billion. Net debt to adjusted EBITDA ratio improved 38% to 2.8 times, compared to 4.5 times at December 31, 2016. During 2017, the Company took steps to improve its maturity schedule and now has only $92 million in bonds due prior to 2022. The undrawn revolver and the cash maintained on the balance sheet anchor the strong liquidity position the Company has built and intends to maintain as part of its disciplined financial plan.
During 2017, Southwestern invested a total of $1.3 billion in capital. This included approximately $1.25 billion invested in its E&P business, $32 million invested in its Midstream segment and $13 million invested for corporate and other purposes. Of the $1.3 billion, approximately $113 million was associated with capitalized interest and $104 million was associated with capitalized expenses.
2017 Operational Review
During the fourth quarter of 2017, Southwestern invested a total of approximately $327 million in the E&P business and drilled 28 wells, completed 35 wells, and placed 36 wells to sales.
|
Three Months Ended Dec 31, 2017 E&P Division Results
|
Appalachia
|
|
Fayetteville
|
|
Northeast
|
|
Southwest
|
|
Shale
|
|
Production (Bcfe) (1)
|
|
110
|
|
|
52
|
|
|
75
|
|
|
|
|
|
|
|
|
|
|
Capital investments ($ in millions)
|
|
|
|
|
|
|
|
|
|
Exploratory and development drilling, including workovers
|
$
|
105
|
|
$
|
109
|
|
$
|
9
|
|
Acquisition and leasehold
|
|
2
|
|
|
13
|
|
|
-
|
|
Seismic and other
|
|
4
|
|
|
1
|
|
|
3
|
|
Capitalized interest and expense
|
|
11
|
|
|
34
|
|
|
5
|
|
Total capital investments
|
$
|
122
|
|
$
|
157
|
|
$
|
17
|
|
|
|
|
|
|
|
|
|
|
Gross operated well count summary
|
|
|
|
|
|
|
|
|
|
Drilled
|
|
11
|
|
|
17
|
|
|
-
|
|
Completed
|
|
22
|
|
|
12
|
|
|
1
|
|
Wells to sales
|
|
23
|
|
|
11
|
|
|
2
|
|
|
|
|
|
|
|
|
|
|
Realized Price
|
|
|
|
|
|
|
|
|
|
NYMEX Henry Hub Price ($/MMBtu)
|
$
|
2.93
|
|
$
|
2.93
|
|
$
|
2.93
|
|
Discount to NYMEX ($/Mcf)(2)
|
$
|
(1.08)
|
|
$
|
(0.93)
|
|
$
|
(0.71)
|
|
Average realized gas price, excluding hedges ($/Mcf)
|
$
|
1.85
|
|
$
|
2.00
|
|
$
|
2.22
|
|
|
|
(1)
|
Southwest Appalachia production included 25 Bcf of natural gas, 4,095 MBbls of NGLs and 555 MBbls of oil.
|
|
(2)
|
This discount includes a basis differential, physical basis sales, third-party transportation charges and fuel charges and excludes financial basis hedges.
|
During 2017, Southwestern invested a total of approximately $1.25 billion in the E&P business, and drilled 134 wells, completed 151 wells, placed 166 wells to sales and had 92 wells in progress at year-end. Of these 92 wells, 52 and 40 were located in our Northeast Appalachia and Southwest Appalachia, respectively, and 19 of these wells are waiting on pipeline or production facilities.
|
|
|
|
|
|
|
|
|
|
Year-end 2017 E&P Division Results
|
Appalachia
|
|
Fayetteville
|
|
Northeast
|
|
Southwest
|
|
Shale
|
|
Production (Bcfe) (1)
|
|
395
|
|
|
183
|
|
|
316
|
|
Gross operated production at year-end 2017 (Mmcfe/d)(2)
|
|
1,446
|
|
|
901
|
|
|
1,170
|
|
|
|
|
|
|
|
|
|
|
Reserves (Bcfe)
|
|
4,126
|
|
|
6,962
|
|
|
3,679
|
|
|
|
|
|
|
|
|
|
|
Capital investments ($ in millions)
|
|
|
|
|
|
|
|
|
|
Exploratory and development drilling, including workovers
|
$
|
420
|
|
$
|
353
|
|
$
|
82
|
|
Acquisition and leasehold
|
|
14
|
|
|
59
|
|
|
1
|
|
Seismic and other
|
|
13
|
|
|
4
|
|
|
9
|
|
Capitalized interest and expense
|
|
42
|
|
|
131
|
|
|
22
|
|
Total capital investments
|
$
|
489
|
|
$
|
547
|
|
$
|
114
|
|
|
|
|
|
|
|
|
|
|
Gross operated well count summary
|
|
|
|
|
|
|
|
|
|
Drilled
|
|
67
|
|
|
53
|
|
|
13
|
|
Completed
|
|
77
|
|
|
50
|
|
|
23
|
|
Wells to sales
|
|
83
|
|
|
57
|
|
|
25
|
|
Wells in progress
|
|
52
|
|
|
40
|
|
|
-
|
|
Year-end drilled uncompleted wells
|
|
30
|
|
|
36
|
|
|
-
|
|
|
|
|
|
|
|
|
|
|
Realized price
|
|
|
|
|
|
|
|
|
|
NYMEX Henry Hub price ($/MMBtu)
|
$
|
3.11
|
|
$
|
3.11
|
|
$
|
3.11
|
|
Discount to NYMEX ($/Mcf) (3)
|
$
|
(1.00)
|
|
$
|
(0.83)
|
|
$
|
(0.76)
|
|
Average realized gas price, excluding hedges ($/Mcf)
|
$
|
2.11
|
|
$
|
2.28
|
|
$
|
2.35
|
|
|
|
(1)
|
SW Appalachia production included 85 Bcf of natural gas, 14,193 MBbls of NGLs and 2,228 MBbls of oil.
|
|
(2)
|
Based on average rates for the month of December 2017.
|
|
(3)
|
This discount includes a basis differential, physical basis sales, third-party transportation charges and fuel charges and excludes financial basis hedges.
|
|
|
|
|
|
|
|
For the years ended December 31,
|
|
2017
|
|
2016
|
|
E&P Capital Investments by Type
|
(in millions)
|
|
Exploratory and development drilling, including workovers
|
$
|
878
|
|
$
|
358
|
|
Acquisitions and leasehold
|
|
86
|
|
|
23
|
|
Seismic expenditures
|
|
7
|
|
|
1
|
|
Drilling rigs, sand facility, water infrastructure and other
|
|
65
|
|
|
2
|
|
Capitalized interest and other expenses
|
|
212
|
|
|
239
|
|
Total E&P capital investments
|
$
|
1,248
|
|
$
|
623
|
|
|
|
|
|
|
|
E&P Capital Investments by Area
|
|
|
|
|
|
|
Northeast Appalachia
|
$
|
447
|
|
$
|
165
|
|
Southwest Appalachia
|
|
416
|
|
|
130
|
|
Fayetteville Shale
|
|
92
|
|
|
65
|
|
Exploration
|
|
24
|
|
|
(2)
|
|
E&P Services & Other
|
|
57
|
|
|
26
|
|
Capitalized interest and other expenses
|
|
212
|
|
|
239
|
|
Total E&P capital investments
|
$
|
1,248
|
|
$
|
623
|
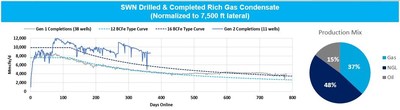
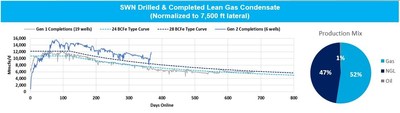
Southwest Appalachia – Southwest Appalachia's gross operated exit production rate increased by 56%, compared to December 2016, to approximately 901 MMcfe per day. Southwestern brought online 57 wells in Southwest Appalachia in 2017, which included 46 Marcellus wells drilled and completed by Southwestern. The 46 wells included 27 targeting the rich gas window, 16 targeting the lean gas window and 3 targeting dry gas Marcellus. The 46 wells had an average lateral length of 7,451 feet and an average cost of $7.4 million per well. This compares to an average completed operated well cost of $5.4 million per well and an average horizontal lateral length of 5,275 feet in 2016. In 2017, the Company continued its completion optimization efforts to improve well performance. Southwest Appalachia increased stage density and sand loading by 20% and 14%, respectively in 2017 and increased its average horizontal lateral length by over 2,000 feet, or 41%, compared to 2016. These efforts on drilling longer laterals, driving down costs and increasing operational efficiency were able to more than offset the additional cost of higher intensity completions, yielding higher well productivity and higher well level returns. The Company will focus on further extending lateral lengths on future wells to create additional value that has been demonstrated on the long lateral wells drilled to date.
Operational Highlights:
- Brought online 11 wells in the fourth quarter, which included 7 wells drilled and completed by Southwestern and 4 wells that were drilled by the previous operator and were waiting on infrastructure. The 7 wells drilled and completed by the Company had an average lateral length of 7,801 feet and an average cost of $8.8 million per well, which included additional costs for enhanced completion testing;
- Improved well recoveries in the lean gas window, as evidenced by the 4-well Gladys Briggs pad in Marshall County that was brought online in July 2017 and has an average EUR per well of 25 Bcfe, or 3.8 Bcfe/1,000 feet, and F&D costs of $0.24 per Mcfe, a 20% improvement compared to the Company's lean gas type curve;
- Expanded the Company's prospective rich gas footprint by placing its northern most pad to sales in Brooke County, which has produced 7.9 Bcfe, comprised of 68% liquids from four wells after 240 days online. The productivity of these wells continues to improve capital efficiency and returns with average F&D costs of $0.50 per Mcfe and a break-even gas price of less than $1.00 with oil prices of approximately $55 per Bbl; and
- Increased type curves as a result of the continued well outperformance from enhanced drilling and completion designs.
Northeast Appalachia – Northeast Appalachia's gross operated exit production rate increased 32% compared to December 2016, to approximately 1,446 MMcfe per day. In 2017, the Company's operated horizontal wells had an average completed well cost of $5.9 million per well and an average horizontal lateral length of 6,185 feet. This compares to an average completed operated well cost of $5.3 million per well and an average horizontal lateral length of 6,142 feet in 2016. The increased costs were primarily due to increased activity in delineation areas. The increase in costs were more than offset by efficiency and productivity gains, resulting in a 7% improvement in finding & development costs.
Operational Highlights:
- In the fourth quarter of 2017, the Company placed 23 wells to sales, which had an average lateral length of 5,754 feet and an average cost of $5.4 million per well. The average rate for the first 30 days for the 15 wells that were online for at least 30 days was 16.9 MMcf per day per well;
- Placed two wells to sales in eastern Susquehanna County, with an average lateral length of over 9,600 feet, delivering a Susquehanna County company record average IP rate of over 34 MMcf per day per well;
- Commenced development on its 28,000 acre Tioga area with gross production increasing to 73 MMcf per day at year-end 2017, adding the first phase of compression during the fourth quarter; and
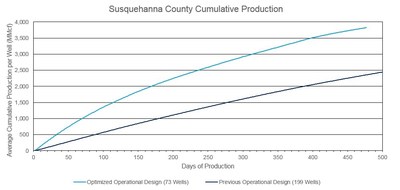
- Increased type curves due to the demonstrated continued well outperformance from enhanced completion designs, resulting in an approximately 75% increase in cumulative production in the first year of production.
Fayetteville Shale – The Company generated approximately $400 million in positive cash flow from operations, net of capital investments from its Fayetteville E&P and midstream gathering assets in 2017.
Operational Highlights:
- Identified significant opportunity for additional future value in the Fayetteville shale via the redevelopment of legacy areas with latest generation drilling and completion techniques coupled with selective application of longer laterals, which has applications across the Company's vast position concentrated in the core of the play
- First redevelopment well in the Fayetteville shale tested with a 40% improvement in initial production rates over historical wells; and
- Additional activity is being undertaken to further define this opportunity set.
- Unlocked additional future value with positive Moorefield delineation efforts increasing the derisked productive Moorefield acreage to approximately 36,000 net acres of the almost 100,000 net acres prospective in the play
- The first step out well, located in the southwest portion of the play, used engineered completion design that delivered encouraging results with an average 30-day rate of 6.2 MMcf per day; and
- The second step out well produced higher water volumes than expected, an identified pre-drill risk in this portion of the field.
2017 Natural Gas and Oil Reserves
Southwestern's estimated proved natural gas and oil reserves, audited by an independent petroleum engineering firm, increased by 181% to approximately 14,775 Bcfe at December 31, 2017. The following tables detail additional information relating to reserve estimates as of and for the year ended December 31, 2017:
|
|
|
|
|
|
|
|
|
Proved Reserves Summary
|
For the years ended December 31,
|
|
2017
|
|
2016
|
|
Proved reserves (in Bcfe)
|
|
14,775
|
|
|
5,253
|
|
Prices used
|
|
|
|
|
|
|
Natural gas (per Mcf)
|
$
|
2.98
|
|
$
|
2.48
|
|
Oil (per barrel)
|
$
|
47.79
|
|
$
|
39.25
|
|
NGL (per barrel)
|
$
|
14.41
|
|
$
|
6.74
|
|
|
|
|
|
|
|
PV-10:
|
|
|
|
|
|
|
Pre-Tax (millions)
|
$
|
5,784
|
|
$
|
1,665
|
|
PV of Taxes (millions)
|
|
(222)
|
|
|
–
|
|
After-Tax (millions)
|
$
|
5,562
|
|
$
|
1,665
|
|
|
|
|
|
|
|
Percent of estimated proved reserves that are:
|
|
|
|
|
|
|
Natural gas
|
|
75%
|
|
|
93%
|
|
Proved developed
|
|
54%
|
|
|
99%
|
|
|
|
|
|
|
|
|
|
2017 Proved Reserves by Commodity
|
Natural Gas
|
|
Oil
|
|
NGL
|
|
Total
|
|
(Bcf)
|
|
(MBbls)
|
|
(MBbls)
|
|
(Bcfe)
|
|
|
|
|
|
|
|
|
|
Proved reserves, beginning of year
|
4,866
|
|
10,523
|
|
53,931
|
|
5,253
|
|
Revisions of previous estimates
|
1,898
|
|
1,668
|
|
70,549
|
|
2,332
|
|
Extensions, discoveries and other additions(1)
|
5,159
|
|
55,772
|
|
432,220
|
|
8,087
|
|
Production
|
(797)
|
|
(2,327)
|
|
(14,245)
|
|
(897)
|
|
Acquisition of reserves in place
|
–
|
|
–
|
|
–
|
|
–
|
|
Disposition of reserves in place
|
–
|
|
–
|
|
–
|
|
–
|
|
Proved reserves, end of year
|
11,126
|
|
65,636
|
|
542,455
|
|
14,775
|
|
|
|
|
|
|
|
|
|
Proved developed reserves:
|
|
|
|
|
|
|
|
|
Beginning of year
|
4,789
|
|
10,523
|
|
53,931
|
|
5,176
|
|
End of year
|
6,979
|
|
14,513
|
|
142,213
|
|
7,920
|
|
|
Note: Amounts may not add due to rounding
|
|
(1)
|
The 2017 PUD additions are primarily associated with the increase in commodity prices.
|
|
|
|
|
|
|
|
|
|
|
|
|
2017 Proved Reserves by Division
|
|
Appalachia
|
|
Fayetteville
|
|
|
|
|
|
|
Northeast
|
|
Southwest
|
|
Shale
|
|
Other
|
|
Total
|
|
Estimated Proved Reserves (Bcfe):
|
|
|
|
|
|
|
|
|
|
|
|
Reserves, beginning of year
|
|
1,574
|
|
677
|
|
2,997
|
|
5
|
|
5,253
|
|
Production
|
|
(395)
|
|
(183)
|
|
(316)
|
|
(3)
|
|
(897)
|
|
Extensions, discoveries and other additions(1)
|
|
1,890
|
|
5,605
|
|
591
|
|
1
|
|
8,087
|
|
Price revisions
|
|
903
|
|
738
|
|
49
|
|
1
|
|
1,691
|
|
Performance & production revisions
|
|
154
|
|
125
|
|
358
|
|
4
|
|
641
|
|
Reserves, end of year
|
|
4,126
|
|
6,962
|
|
3,679
|
|
8
|
|
14,775
|
|
|
|
(1)
|
The 2017 PUD additions are primarily associated with the increase in commodity prices.
|
|
|
|
|
|
|
|
|
|
|
|
|
|
|
|
|
2017 PROVED RESERVES BY CATEGORY AND SUMMARY OPERATING DATA
|
|
|
|
|
|
|
|
|
|
|
|
|
|
|
|
|
Appalachia
|
|
Fayetteville
|
|
|
|
|
|
|
Northeast
|
|
Southwest
|
|
Shale
|
|
Other (1)
|
|
Total
|
|
Estimated Proved Reserves:
|
|
|
|
|
|
|
|
|
|
|
|
|
|
|
|
Natural Gas (Bcf):
|
|
|
|
|
|
|
|
|
|
|
|
|
|
|
|
Developed (Bcf)
|
|
3,007
|
|
|
833
|
|
|
3,135
|
|
|
4
|
|
|
6,979
|
|
Undeveloped (Bcf)
|
|
1,119
|
|
|
2,484
|
|
|
544
|
|
|
–
|
|
|
4,147
|
|
|
4,126
|
|
|
3,317
|
|
|
3,679
|
|
|
4
|
|
|
11,126
|
|
Crude Oil (MMBbls):
|
|
|
|
|
|
|
|
|
|
|
|
|
|
|
|
Developed (MMBbls)
|
|
–
|
|
|
14.2
|
|
|
–
|
|
|
0.3
|
|
|
14.5
|
|
Undeveloped (MMBbls)
|
|
–
|
|
|
51.1
|
|
|
–
|
|
|
–
|
|
|
51.1
|
|
|
–
|
|
|
65.3
|
|
|
–
|
|
|
0.3
|
|
|
65.6
|
|
Natural Gas Liquids (MMBbls):
|
|
|
|
|
|
|
|
|
|
|
|
|
|
|
|
Developed (MMBbls)
|
|
–
|
|
|
141.9
|
|
|
–
|
|
|
0.3
|
|
|
142.2
|
|
Undeveloped (MMBbls)
|
|
–
|
|
|
400.2
|
|
|
–
|
|
|
–
|
|
|
400.2
|
|
|
–
|
|
|
542.1
|
|
|
–
|
|
|
0.3
|
|
|
542.4
|
|
Total Proved Reserves (Bcfe) (2):
|
|
|
|
|
|
|
|
|
|
|
|
|
|
|
|
Developed (Bcfe)
|
|
3,007
|
|
|
1,770
|
|
|
3,135
|
|
|
8
|
|
|
7,920
|
|
Undeveloped (Bcfe)
|
|
1,119
|
|
|
5,192
|
|
|
544
|
|
|
–
|
|
|
6,855
|
|
|
4,126
|
|
|
6,962
|
|
|
3,679
|
|
|
8
|
|
|
14,775
|
|
Percent of Total
|
|
28%
|
|
|
47%
|
|
|
25%
|
|
|
0%
|
|
|
100%
|
|
|
|
|
|
|
|
|
|
|
|
|
|
|
|
|
Percent Proved Developed
|
|
73%
|
|
|
25%
|
|
|
85%
|
|
|
100%
|
|
|
54%
|
|
Percent Proved Undeveloped
|
|
27%
|
|
|
75%
|
|
|
15%
|
|
|
0%
|
|
|
46%
|
|
|
|
|
|
|
|
|
|
|
|
|
|
|
|
|
Production (Bcfe)
|
|
395
|
|
|
183
|
|
|
316
|
|
|
3
|
|
|
897
|
|
Capital Investments (in millions) (3)
|
$
|
489
|
|
$
|
547
|
|
$
|
114
|
|
$
|
41
|
|
$
|
1,191
|
|
Total Gross Producing Wells (4)
|
|
983
|
|
|
364
|
|
|
4,191
|
|
|
20
|
|
|
5,558
|
|
Total Net Producing Wells (4)
|
|
516
|
|
|
255
|
|
|
2,921
|
|
|
17
|
|
|
3,709
|
|
|
|
|
|
|
|
|
|
|
|
|
|
|
|
|
Total Net Acreage
|
|
191,226
|
|
|
290,291
|
|
|
917,842
|
|
|
386,304
|
(5)
|
|
1,785,663
|
|
Net Undeveloped Acreage
|
|
87,927
|
|
|
219,709
|
|
|
424,858
|
|
|
369,236
|
(5)
|
|
1,101,730
|
|
|
|
|
|
|
|
|
|
|
|
|
|
|
|
|
PV-10:
|
|
|
|
|
|
|
|
|
|
|
|
|
|
|
|
Pre-Tax (in millions) (6)
|
$
|
2,085
|
|
$
|
1,718
|
|
$
|
1,978
|
|
$
|
3
|
|
$
|
5,784
|
|
PV of Taxes (in millions) (6)
|
|
80
|
|
|
66
|
|
|
76
|
|
|
–
|
|
|
222
|
|
After-Tax (in millions) (6)
|
$
|
2,005
|
|
$
|
1,652
|
|
$
|
1,902
|
|
$
|
3
|
|
$
|
5,562
|
|
Percent of Total
|
|
36%
|
|
|
30%
|
|
|
34%
|
|
|
0%
|
|
|
100%
|
|
Percent Operated (7)
|
|
99%
|
|
|
100%
|
|
|
99%
|
|
|
100%
|
|
|
99%
|
|
|
|
(1)
|
Other consists primarily of properties in Canada, Colorado and Louisiana.
|
|
(2)
|
We have no reserves from synthetic gas, synthetic oil or nonrenewable natural resources intended to be upgraded into synthetic gas or oil. We used standard engineering and geoscience methods, or a combination of methodologies in determining estimates of material properties, including performance and test date analysis offset statistical analogy of performance data, volumetric evaluation, including analysis of petrophysical parameters (including porosity, net pay, fluid saturations (i.e., water, oil and gas) and permeability) in combination with estimated reservoir parameters (including reservoir temperature and pressure, formation depth and formation volume factors), geological analysis, including structure and isopach maps and seismic analysis, including review of 2-D and 3-D data to ascertain faults, closure and other factors.
|
|
(3)
|
Total and Other capital investments excludes $57 million related to our E&P service companies, of which $37 million related to water infrastructure.
|
|
(4)
|
Represents producing wells, including 400 wells in which we only have an overriding royalty interest in Northeast Appalachia, used in the December 31, 2017 reserves calculation.
|
|
(5)
|
Excludes exploration licenses for 2,518,519 net acres in New Brunswick, Canada, which have been subject to a moratorium since 2015.
|
|
(6)
|
Pre-tax PV-10 (a non-GAAP measure) is one measure of the value of a company's proved reserves that we believe is used by securities analysts to compare relative values among peer companies without regard to income taxes. The reconciling difference in pre-tax PV-10 and the after-tax PV-10, or standardized measure, is the discounted value of future income taxes on the estimated cash flows from our proved natural gas, oil and NGL reserves.
|
|
(7)
|
Based upon pre-tax PV-10 of proved developed producing activities.
|
The Company's 2017 and three-year average proved developed finding and development (PD F&D) costs were $0.72 and $0.80 per Mcfe, respectively, when excluding the impact of capitalizing interest and portions of G&A costs in accordance with the full cost method of accounting.
|
|
|
|
|
|
|
|
|
|
|
|
|
Total Company PD F&D
|
|
|
Three-Year
|
|
12 Months Ended December 31,
|
|
Total
|
|
2017
|
|
2016
|
|
2015
|
|
2017
|
|
Total PD Adds (Bcfe):
|
|
|
|
|
|
|
|
|
|
|
|
|
New PD adds
|
|
1,258
|
|
|
257
|
|
|
416
|
|
|
1,931
|
|
PUD conversions
|
|
46
|
|
|
220
|
|
|
1,044
|
|
|
1,310
|
|
Total PD Adds
|
|
1,304
|
|
|
477
|
|
|
1,460
|
|
|
3,241
|
|
|
|
|
|
|
|
|
|
|
|
|
|
Costs Incurred (in millions):
|
|
|
|
|
|
|
|
|
|
|
|
|
Proved property acquisition costs
|
$
|
–
|
|
$
|
–
|
|
$
|
81
|
|
$
|
81
|
|
Unproved property acquisition costs
|
|
194
|
|
|
171
|
|
|
692
|
|
|
1,057
|
|
Exploration costs
|
|
22
|
|
|
17
|
|
|
50
|
|
|
89
|
|
Development costs
|
|
1,024
|
|
|
433
|
|
|
1,417
|
|
|
2,874
|
|
Capitalized Costs Incurred
|
$
|
1,240
|
|
$
|
621
|
|
$
|
2,240
|
|
$
|
4,101
|
|
|
|
|
|
|
|
|
|
|
|
|
|
Subtract (in millions):
|
|
|
|
|
|
|
|
|
|
|
|
|
Proved property acquisition costs
|
$
|
–
|
|
$
|
–
|
|
$
|
(81)
|
|
$
|
(81)
|
|
Unproved property acquisition costs
|
|
(194)
|
|
|
(171)
|
|
|
(692)
|
|
|
(1,057)
|
|
Capitalized interest and expense(1) associated with development and exploration
|
|
(103)
|
|
|
(91)
|
|
|
(187)
|
|
|
(381)
|
|
PD Costs Incurred
|
$
|
943
|
|
$
|
359
|
|
$
|
1,280
|
|
$
|
2,582
|
|
|
|
|
|
|
|
|
|
|
|
|
|
PD F&D
|
$
|
0.72
|
|
$
|
0.75
|
|
$
|
0.88
|
|
$
|
0.80
|
|
|
|
Note: Amounts may not add due to rounding
|
|
(1)
|
Adjusting for the impacts of the full cost accounting method for comparability.
|
|
Division PD F&D
|
12 Months Ended December 31, 2017
|
|
Appalachia
|
|
Fayetteville
|
|
|
|
|
|
Northeast
|
|
Southwest
|
|
Shale
|
|
Other
|
|
Total
|
|
Total PD Adds (Bcfe):
|
|
|
|
|
|
|
|
|
|
|
|
|
|
|
|
New PD adds
|
|
790
|
|
|
419
|
|
|
48
|
|
|
1
|
|
|
1,258
|
|
PUD conversions
|
|
17
|
|
|
–
|
|
|
29
|
|
|
–
|
|
|
46
|
|
Total PD Adds
|
|
807
|
|
|
419
|
|
|
77
|
|
|
1
|
|
|
1,304
|
|
|
|
|
|
|
|
|
|
|
|
|
|
|
|
|
Costs Incurred (in millions):
|
|
|
|
|
|
|
|
|
|
|
|
|
|
|
|
Proved property acquisition costs
|
$
|
–
|
|
$
|
–
|
|
$
|
–
|
|
$
|
–
|
|
$
|
–
|
|
Unproved property acquisition costs
|
|
20
|
|
|
154
|
|
|
1
|
|
|
19
|
|
|
194
|
|
Exploration costs
|
|
8
|
|
|
3
|
|
|
–
|
|
|
11
|
|
|
22
|
|
Development costs
|
|
471
|
|
|
402
|
|
|
125
|
|
|
26
|
|
|
1,024
|
|
Capitalized Costs Incurred
|
$
|
499
|
|
$
|
559
|
|
$
|
126
|
|
$
|
56
|
|
$
|
1,240
|
|
|
|
|
|
|
|
|
|
|
|
|
|
|
|
|
Subtract (in millions):
|
|
|
|
|
|
|
|
|
|
|
|
|
|
|
|
Proved property acquisition costs
|
$
|
–
|
|
$
|
–
|
|
$
|
–
|
|
$
|
–
|
|
$
|
–
|
|
Unproved property acquisition costs
|
|
(20)
|
|
|
(154)
|
|
|
(1)
|
|
|
(19)
|
|
|
(194)
|
|
Capitalized interest and expense(1) associated with development and exploration
|
|
(36)
|
|
|
(38)
|
|
|
(18)
|
|
|
(11)
|
|
|
(103)
|
|
PD Costs Incurred
|
$
|
443
|
|
$
|
367
|
|
$
|
107
|
|
$
|
26
|
|
$
|
943
|
|
|
|
|
|
|
|
|
|
|
|
|
|
|
|
|
PD F&D
|
$
|
0.55
|
|
$
|
0.88
|
|
$
|
1.39
|
|
$
|
–
|
|
$
|
0.72
|
|
|
|
Note: Amounts may not add due to rounding
|
|
(1)
|
Adjusting for the impacts of the full cost accounting method for comparability.
|
Explanation and Reconciliation of Non-GAAP Financial Measures
The Company reports its financial results in accordance with accounting principles generally accepted in the United States of America ("GAAP"). However, management believes certain non-GAAP performance measures may provide financial statement users with additional meaningful comparisons between current results, the results of its peers and of prior periods.
One such non-GAAP financial measure is net cash flow. Management presents this measure because (i) it is accepted as an indicator of an oil and gas exploration and production company's ability to internally fund exploration and development activities and to service or incur additional debt, (ii) changes in operating assets and liabilities relate to the timing of cash receipts and disbursements which the Company may not control and (iii) changes in operating assets and liabilities may not relate to the period in which the operating activities occurred.
Additional non-GAAP financial measures the Company may present from time to time are net debt, adjusted net income, adjusted diluted earnings per share, adjusted EBITDA and its E&P and Midstream segment operating income, all which exclude certain charges or amounts. Management presents these measures because (i) they are consistent with the manner in which the Company's position and performance are measured relative to the position and performance of its peers, (ii) these measures are more comparable to earnings estimates provided by securities analysts, and (iii) charges or amounts excluded cannot be reasonably estimated and guidance provided by the Company excludes information regarding these types of items. These adjusted amounts are not a measure of financial performance under GAAP.
See the reconciliations throughout this release of GAAP financial measures to non-GAAP financial measures for the three and twelve months ended December 31, 2017 and December 31, 2016, as applicable. Non-GAAP financial measures should not be considered in isolation or as a substitute for the Company's reported results prepared in accordance with GAAP.
Proved developed finding and development costs – Proved developed (PD) finding and development (F&D) costs are computed here by dividing exploration and development capital costs incurred, excluding capitalized interest and expenses, for the indicated period by PD reserve additions and proved undeveloped (PUD) conversions for that same period. At times, adjustments are made to this calculation in order to improve usefulness for investors. For example, adjustments are made to exclude the differences between accounting methods to improve comparability. The following computes PD F&D costs for the periods ending December 31, 2017, 2016 and 2015 and the three years ending December 31, 2017.
The Company believes that providing a measure of PD F&D costs is useful for investors as a means of evaluating a Company's cost to add proved reserves on a per thousand cubic feet of natural gas equivalent basis. These measures are provided in addition to, and not as an alternative for the financial statements, including the notes thereto, contained in Southwestern's Annual Report on Form 10-K. Due to various factors, including timing differences, PD F&D costs do not necessarily reflect precisely the costs associated with particular reserves. Changes in commodity prices can affect the magnitude of recorded increases in reserves independent of the related costs of such increases. As a result of the foregoing factors and various factors that could materially affect the timing and amounts of future increases in reserves and the timing and amounts of future costs, including factors disclosed in Southwestern's filings with the SEC, future PD F&D costs may differ materially from those set forth above. Further, the methods used by Southwestern to calculate its PD F&D costs may differ significantly from methods used by other companies to compute similar measures and, as a result, Southwestern's PD F&D costs may not be comparable to similar measures provided by other companies.
|
|
|
|
|
|
|
3 Months Ended December 31,
|
|
2017
|
|
2016
|
|
(in millions)
|
|
Net income (loss) attributable to common stock:
|
|
|
|
|
|
|
Net income (loss) attributable to common stock
|
$
|
267
|
|
$
|
(237)
|
|
Add back:
|
|
|
|
|
|
|
Participating securities - mandatory convertible preferred stock
|
|
31
|
|
|
(6)
|
|
Impairment of natural gas and oil properties
|
|
–
|
|
|
–
|
|
Restructuring and other one-time charges
|
|
–
|
|
|
12
|
|
Gain on sale of assets, net
|
|
(1)
|
|
|
–
|
|
Loss on early extinguishment of debt and other bank fees
|
|
3
|
|
|
–
|
|
(Gain) loss on certain derivatives
|
|
(101)
|
|
|
324
|
|
Adjustments due to inventory valuation and other
|
|
(1)
|
|
|
–
|
|
Loss on foreign currency adjustment
|
|
6
|
|
|
–
|
|
Adjustments due to discrete tax items(1)
|
|
(176)
|
|
|
74
|
|
Tax impact on adjustments
|
|
35
|
|
|
(128)
|
|
Adjusted net income attributable to common stock
|
$
|
63
|
|
$
|
39
|
|
|
|
(1)
|
Primarily relates to the exclusion of certain discrete tax adjustments associated with the valuation allowance against deferred tax assets. The Company expects its 2018 income tax rate to be 24.5% before the impacts of any valuation allowance.
|
|
|
|
|
|
|
|
3 Months Ended December 31,
|
|
2017
|
|
2016
|
|
Diluted earnings (loss) per share:
|
|
|
|
|
|
|
Diluted earnings (loss) per share
|
$
|
0.53
|
|
$
|
(0.48)
|
|
Add back:
|
|
|
|
|
|
|
Participating securities - mandatory convertible preferred stock
|
|
0.06
|
|
|
(0.01)
|
|
Impairment of natural gas and oil properties
|
|
–
|
|
|
–
|
|
Restructuring and other one-time charges
|
|
–
|
|
|
0.02
|
|
Gain on sale of assets, net
|
|
(0.00)
|
|
|
–
|
|
Loss on early extinguishment of debt and other bank fees
|
|
0.01
|
|
|
–
|
|
(Gain) loss on certain derivatives
|
|
(0.20)
|
|
|
0.66
|
|
Adjustments due to inventory valuation and other
|
|
(0.00)
|
|
|
–
|
|
Loss on foreign currency adjustment
|
|
0.01
|
|
|
–
|
|
Adjustments due to discrete tax items(1)
|
|
(0.36)
|
|
|
0.15
|
|
Tax impact on adjustments
|
|
0.07
|
|
|
(0.26)
|
|
Adjusted diluted earnings per share
|
$
|
0.12
|
|
$
|
0.08
|
|
|
|
(1)
|
Primarily relates to the exclusion of certain discrete tax adjustments associated with the valuation allowance against deferred tax assets. The Company expects its 2018 income tax rate to be 24.5% before the impacts of any valuation allowance.
|
|
|
|
|
|
|
|
12 Months Ended December 31,
|
|
2017
|
|
2016
|
|
(in millions)
|
|
Net income (loss) attributable to common stock:
|
|
|
|
|
|
|
Net income (loss) attributable to common stock
|
$
|
815
|
|
$
|
(2,751)
|
|
Add back:
|
|
|
|
|
|
|
Participating securities – mandatory convertible preferred stock
|
|
90
|
|
|
–
|
|
Impairment of natural gas and oil properties
|
|
–
|
|
|
2,321
|
|
Restructuring and other one-time charges
|
|
–
|
|
|
89
|
|
Gain on sale of assets, net
|
|
(4)
|
|
|
(3)
|
|
Loss on early extinguishment of debt and other bank fees(1)
|
|
73
|
|
|
57
|
|
Legal settlements
|
|
5
|
|
|
–
|
|
(Gain) loss on certain derivatives
|
|
(451)
|
|
|
373
|
|
Loss on foreign currency adjustment
|
|
6
|
|
|
–
|
|
Adjustments due to inventory valuation and other
|
|
(2)
|
|
|
3
|
|
Adjustments due to discrete tax items(2)
|
|
(455)
|
|
|
978
|
|
Tax impact on adjustments
|
|
142
|
|
|
(1,074)
|
|
Adjusted net income (loss) attributable to common stock
|
$
|
219
|
|
$
|
(7)
|
|
|
|
(1)
|
2016 includes a $51 million loss for the redemption of certain senior notes and a $6 million loss related to the unamortized debt issuance costs and debt discounts associated with the extinguished debt which were included in other interest charges.
|
|
(2)
|
Primarily relates to the exclusion of certain discrete tax adjustments associated with the valuation allowance against deferred tax assets. The Company expects its 2018 income tax rate to be 24.5% before the impacts of any valuation allowance.
|
|
|
|
|
|
|
|
12 Months Ended December 31,
|
|
2017
|
|
2016
|
|
Diluted earnings (loss) per share:
|
|
|
|
|
|
|
Diluted earnings (loss) per share
|
$
|
1.63
|
|
$
|
(6.32)
|
|
Add back:
|
|
|
|
|
|
|
Participating securities – mandatory convertible preferred stock
|
|
0.18
|
|
|
–
|
|
Impairment of natural gas and oil properties
|
|
–
|
|
|
5.33
|
|
Restructuring and other one-time charges
|
|
–
|
|
|
0.20
|
|
Gain on sale of assets, net
|
|
(0.01)
|
|
|
(0.00)
|
|
Loss on early extinguishment of debt and other bank fees(1)
|
|
0.15
|
|
|
0.13
|
|
Legal settlements
|
|
0.01
|
|
|
–
|
|
(Gain) loss on certain derivatives
|
|
(0.90)
|
|
|
0.86
|
|
Loss on foreign currency adjustment
|
|
0.01
|
|
|
–
|
|
Adjustments due to inventory valuation and other
|
|
(0.00)
|
|
|
0.01
|
|
Adjustments due to discrete tax items(2)
|
|
(0.91)
|
|
|
2.25
|
|
Tax impact on adjustments
|
|
0.28
|
|
|
(2.47)
|
|
Adjusted diluted earnings (loss) per share
|
$
|
0.44
|
|
$
|
(0.01)
|
|
|
|
(1)
|
Includes a $51 million loss for the redemption of certain senior notes and a $6 million loss related to the unamortized debt issuance costs and debt discounts associated with the extinguished debt which were included in other interest charges.
|
|
(2)
|
Primarily relates to the exclusion of certain discrete tax adjustments associated with the valuation allowance against deferred tax assets. The Company expects its 2018 income tax rate to be 24.5% before the impacts of any valuation allowance.
|
|
|
|
|
|
|
|
3 Months Ended December 31,
|
|
2017
|
|
2016
|
|
(in millions)
|
|
Cash flow from operating activities:
|
|
|
|
|
|
|
Net cash provided by operating activities
|
$
|
308
|
|
$
|
161
|
|
Add back:
|
|
|
|
|
|
|
Changes in operating assets and liabilities
|
|
14
|
|
|
49
|
|
Restructuring charges
|
|
–
|
|
|
1
|
|
Net cash flow
|
$
|
322
|
|
$
|
211
|
|
|
|
|
|
|
|
12 Months Ended December 31,
|
|
2017
|
|
2016
|
|
(in millions)
|
|
Cash flow from operating activities:
|
|
|
|
|
|
|
Net cash provided by operating activities
|
$
|
1,097
|
|
$
|
498
|
|
Add back:
|
|
|
|
|
|
|
Changes in operating assets and liabilities
|
|
41
|
|
|
99
|
|
Restructuring charges
|
|
–
|
|
|
48
|
|
Net cash flow
|
$
|
1,138
|
|
$
|
645
|
|
|
|
|
|
|
|
3 Months Ended December 31,
|
|
2017
|
|
2016
|
|
(in millions)
|
|
Operating income:
|
|
|
|
|
|
|
Operating income
|
$
|
167
|
|
$
|
122
|
|
Add back:
|
|
|
|
|
|
|
Impairment of natural gas and oil properties
|
|
–
|
|
|
–
|
|
Gain on sale of assets, net
|
|
(1)
|
|
|
–
|
|
Loss on early extinguishment of debt and other bank fees
|
|
3
|
|
|
–
|
|
Restructuring and other one-time charges
|
|
–
|
|
|
12
|
|
Adjusted operating income
|
$
|
169
|
|
$
|
134
|
|
|
|
|
|
|
|
12 Months Ended December 31,
|
|
2017
|
|
2016
|
|
(in millions)
|
|
Operating income (loss):
|
|
|
|
|
|
|
Operating income (loss)
|
$
|
731
|
|
$
|
(2,195)
|
|
Add back:
|
|
|
|
|
|
|
Impairment of natural gas and oil properties
|
|
–
|
|
|
2,321
|
|
Gain on sale of assets, net
|
|
(4)
|
|
|
–
|
|
Legal settlements
|
|
5
|
|
|
–
|
|
Loss on early extinguishment of debt and other bank fees
|
|
3
|
|
|
–
|
|
Restructuring and other one-time charges
|
|
–
|
|
|
89
|
|
Adjusted operating income
|
$
|
735
|
|
$
|
215
|
|
|
|
|
|
|
|
3 Months Ended December 31,
|
|
2017
|
|
2016
|
|
(in millions)
|
|
E&P segment operating income:
|
|
|
|
|
|
|
E&P segment operating income
|
$
|
114
|
|
$
|
82
|
|
Add back:
|
|
|
|
|
|
|
Impairment of natural gas and oil properties
|
|
–
|
|
|
–
|
|
Restructuring and other one-time charges
|
|
–
|
|
|
12
|
|
Loss on early extinguishment of debt and other bank fees
|
|
3
|
|
|
–
|
|
Adjusted E&P segment operating income
|
$
|
117
|
|
$
|
94
|
|
|
|
|
|
|
|
12 Months Ended December 31,
|
|
2017
|
|
2016
|
|
(in millions)
|
|
E&P segment operating income (loss):
|
|
|
|
|
|
|
E&P segment operating income (loss)
|
$
|
549
|
|
$
|
(2,404)
|
|
Add back:
|
|
|
|
|
|
|
Impairment of natural gas and oil properties
|
|
–
|
|
|
2,321
|
|
Legal settlements
|
|
5
|
|
|
–
|
|
Loss on early extinguishment of debt and other bank fees
|
|
3
|
|
|
–
|
|
Restructuring and other one-time charges
|
|
–
|
|
|
86
|
|
Adjusted E&P segment operating income
|
$
|
557
|
|
$
|
3
|
|
|
|
|
|
|
|
December 31,
|
|
2017
|
|
2016
|
|
(in millions)
|
|
Net debt:
|
|
|
|
|
|
|
Total debt
|
$
|
4,391
|
|
$
|
4,653
|
|
Subtract:
|
|
|
|
|
|
|
Cash and cash equivalents
|
|
(916)
|
|
|
(1,423)
|
|
Net debt
|
$
|
3,475
|
|
$
|
3,230
|
|
|
|
|
|
|
|
12 Months Ended December 31,
|
|
2017
|
|
2016
|
|
(in millions)
|
|
EBITDA:
|
|
|
|
|
|
|
Net income (loss)
|
$
|
1,046
|
|
$
|
(2,643)
|
|
Add back:
|
|
|
|
|
|
|
Interest expense
|
|
135
|
|
|
88
|
|
Income tax benefit
|
|
(93)
|
|
|
(29)
|
|
Depreciation, depletion and amortization
|
|
504
|
|
|
436
|
|
Impairment of natural gas and oil properties
|
|
–
|
|
|
2,321
|
|
Restructuring and other one-time charges
|
|
–
|
|
|
89
|
|
Gain on sale of assets, net
|
|
(4)
|
|
|
(3)
|
|
Loss on early extinguishment of debt and other bank fees
|
|
73
|
|
|
51
|
|
Legal settlements
|
|
5
|
|
|
–
|
|
(Gain) loss on certain derivatives
|
|
(451)
|
|
|
373
|
|
Loss on foreign currency adjustment
|
|
6
|
|
|
–
|
|
Adjustments due to inventory valuation and other
|
|
(2)
|
|
|
3
|
|
Stock based compensation expense
|
|
28
|
|
|
35
|
|
Adjusted EBITDA
|
$
|
1,247
|
|
$
|
721
|
Southwestern management will host a teleconference call on Friday, March 2, 2018 at 10:00 a.m. Eastern to discuss its fourth quarter and year-end 2017 results. The toll-free number to call is 877-407-8035 and the international dial-in number is 201-689-8035. The teleconference can also be heard "live" on the Internet at http://www.swn.com.
Southwestern Energy Company is an independent energy company whose wholly-owned subsidiaries are engaged in natural gas and oil exploration, development and production, natural gas gathering and marketing. Additional information on the Company can be found on the Internet at http://www.swn.com.
This news release contains forward-looking statements. Forward-looking statements relate to future events and anticipated results of operations, business strategies, and other aspects of our operations or operating results. In many cases you can identify forward-looking statements by terminology such as "anticipate," "intend," "plan," "project," "estimate," "continue," "potential," "should," "could," "may," "will," "objective," "guidance," "outlook," "effort," "expect," "believe," "predict," "budget," "projection," "goal," "forecast," "target" or similar words. Statements may be forward looking even in the absence of these particular words. Where, in any forward-looking statement, the Company expresses an expectation or belief as to future results, such expectation or belief is expressed in good faith and believed to have a reasonable basis. However, there can be no assurance that such expectation or belief will result or be achieved. The actual results of operations can and will be affected by a variety of risks and other matters including, but not limited to, changes in commodity prices; changes in expected levels of natural gas and oil reserves or production; operating hazards, drilling risks, unsuccessful exploratory activities; limited access to capital or significantly higher cost of capital related to illiquidity or uncertainty in the domestic or international financial markets; international monetary conditions; unexpected cost increases; potential liability for remedial actions under existing or future environmental regulations; potential liability resulting from pending or future litigation; and general domestic and international economic and political conditions; as well as changes in tax, environmental and other laws applicable to our business. Other factors that could cause actual results to differ materially from those described in the forward-looking statements include other economic, business, competitive and/or regulatory factors affecting our business generally as set forth in our filings with the Securities and Exchange Commission. Unless legally required, Southwestern Energy Company undertakes no obligation to update publicly any forward-looking statements, whether as a result of new information, future events or otherwise.
Cautionary Note to U.S. Investors – The SEC permits oil and gas companies, in their filings with the SEC, to disclose only proved, probable and possible reserves. We use the term "EUR" in this release that the SEC's guidelines prohibit us from including in filings with the SEC. The quarterly reserves data included in this release are estimates we prepared that have not been audited by our independent reserve engineers. U.S. investors are urged to consider closely the oil and gas disclosures in our Form 10-K and other reports and filings with the SEC. Copies are available from the SEC and from the Southwestern Energy Company website.
|
|
|
|
|
|
|
|
|
|
|
|
|
|
OPERATING STATISTICS (Unaudited)
|
|
|
Southwestern Energy Company and Subsidiaries
|
|
|
|
|
|
|
|
|
|
|
|
|
|
|
|
|
|
|
|
For the three months ended
|
|
For the years ended
|
|
|
December 31,
|
|
December 31,
|
|
|
2017
|
|
2016
|
|
2017
|
|
2016
|
|
Exploration & Production
|
|
|
|
|
|
|
|
|
|
|
|
|
|
Production
|
|
|
|
|
|
|
|
|
|
|
|
|
|
Gas production (Bcf)
|
|
|
210
|
|
|
183
|
|
|
797
|
|
|
788
|
|
Oil production (MBbls)
|
|
|
580
|
|
|
463
|
|
|
2,327
|
|
|
2,192
|
|
NGL production (MBbls)
|
|
|
4,111
|
|
|
2,792
|
|
|
14,245
|
|
|
12,372
|
|
Total production (Bcfe)
|
|
|
239
|
|
|
202
|
|
|
897
|
|
|
875
|
|
Commodity Prices
|
|
|
|
|
|
|
|
|
|
|
|
|
|
Average realized gas price per Mcf, including derivatives
|
|
$
|
2.12
|
|
$
|
2.07
|
|
$
|
2.19
|
|
$
|
1.64
|
|
Average realized gas price per Mcf, excluding derivatives
|
|
$
|
2.00
|
|
$
|
2.00
|
|
$
|
2.23
|
|
$
|
1.59
|
|
Average realized oil price per Bbl
|
|
$
|
48.05
|
|
$
|
41.18
|
|
$
|
43.12
|
|
$
|
31.20
|
|
Average realized NGL price per Bbl, including derivatives
|
|
$
|
17.98
|
|
$
|
12.08
|
|
$
|
14.48
|
|
$
|
7.46
|
|
Average realized NGL price per Bbl, excluding derivatives
|
|
$
|
17.97
|
|
$
|
12.08
|
|
$
|
14.46
|
|
$
|
7.46
|
|
Summary of Derivative Activity in the Statement of Operations
|
|
|
|
|
|
|
|
|
|
|
|
|
|
Settled commodity amounts included in "Gain (Loss) on Derivatives" (in millions)
|
|
$
|
25
|
|
$
|
14
|
|
$
|
(27)
|
|
$
|
36
|
|
Unsettled commodity amounts included in "Gain (Loss) on Derivatives" (in millions)
|
|
$
|
100
|
|
$
|
(330)
|
|
$
|
449
|
|
$
|
(375)
|
|
Average unit costs per Mcfe
|
|
|
|
|
|
|
|
|
|
|
|
|
|
Lease operating expenses
|
|
$
|
0.91
|
|
$
|
0.87
|
|
$
|
0.90
|
|
$
|
0.87
|
|
General & administrative expenses (1)
|
|
$
|
0.22
|
|
$
|
0.27
|
|
$
|
0.22
|
|
$
|
0.22
|
|
Taxes, other than income taxes (2)
|
|
$
|
0.07
|
|
$
|
0.11
|
|
$
|
0.10
|
|
$
|
0.10
|
|
Full cost pool amortization
|
|
$
|
0.48
|
|
$
|
0.30
|
|
$
|
0.45
|
|
$
|
0.38
|
|
Midstream
|
|
|
|
|
|
|
|
|
|
|
|
|
|
Volumes marketed (Bcfe)
|
|
|
285
|
|
|
248
|
|
|
1,067
|
|
|
1,062
|
|
Volumes gathered (Bcf)
|
|
|
119
|
|
|
138
|
|
|
499
|
|
|
601
|
|
|
|
(1)
|
Excludes $5 million of one-time legal charges for the year ended December 31, 2017. Excludes $12 million and $83 million of restructuring and other one-time charges for the three months and year ended December 31, 2016, respectively.
|
|
(2)
|
Excludes $3 million of restructuring charges for the year ended December 31, 2016.
|
|
|
|
|
|
|
|
|
|
|
|
|
|
|
STATEMENTS OF OPERATIONS (Unaudited)
|
|
|
Southwestern Energy Company and Subsidiaries
|
|
|
|
|
|
|
|
|
|
|
|
|
|
|
|
|
|
|
|
|
For the three months ended
|
|
For the years ended
|
|
|
December 31,
|
|
December 31,
|
|
|
2017
|
|
2016
|
|
2017
|
|
2016
|
|
|
|
(in millions, except share/per share amounts)
|
|
Operating Revenues
|
|
|
|
|
|
|
|
|
|
|
|
|
|
Gas sales
|
|
$
|
425
|
|
$
|
367
|
|
$
|
1,793
|
|
$
|
1,273
|
|
Oil sales
|
|
|
29
|
|
|
19
|
|
|
102
|
|
|
69
|
|
NGL sales
|
|
|
74
|
|
|
33
|
|
|
206
|
|
|
92
|
|
Marketing
|
|
|
236
|
|
|
233
|
|
|
972
|
|
|
864
|
|
Gas gathering
|
|
|
41
|
|
|
32
|
|
|
126
|
|
|
138
|
|
Other
|
|
|
4
|
|
|
–
|
|
|
4
|
|
|
–
|
|
|
|
809
|
|
|
684
|
|
|
3,203
|
|
|
2,436
|
|
Operating Costs and Expenses
|
|
|
|
|
|
|
|
|
|
|
|
|
|
Marketing purchases
|
|
|
236
|
|
|
237
|
|
|
976
|
|
|
864
|
|
Operating expenses
|
|
|
190
|
|
|
137
|
|
|
671
|
|
|
592
|
|
General and administrative expenses
|
|
|
63
|
|
|
76
|
|
|
233
|
|
|
247
|
|
Restructuring charges
|
|
|
–
|
|
|
1
|
|
|
–
|
|
|
78
|
|
Depreciation, depletion and amortization
|
|
|
140
|
|
|
87
|
|
|
504
|
|
|
436
|
|
Impairment of natural gas and oil properties
|
|
|
–
|
|
|
–
|
|
|
–
|
|
|
2,321
|
|
Gain on sale of assets, net
|
|
|
(6)
|
|
|
–
|
|
|
(6)
|
|
|
–
|
|
Taxes, other than income taxes
|
|
|
19
|
|
|
24
|
|
|
94
|
|
|
93
|
|
|
|
642
|
|
|
562
|
|
|
2,472
|
|
|
4,631
|
|
Operating Income (Loss)
|
|
|
167
|
|
|
122
|
|
|
731
|
|
|
(2,195)
|
|
Interest Expense
|
|
|
|
|
|
|
|
|
|
|
|
|
|
Interest on debt
|
|
|
64
|
|
|
58
|
|
|
239
|
|
|
226
|
|
Other interest charges
|
|
|
2
|
|
|
2
|
|
|
9
|
|
|
14
|
|
Interest capitalized
|
|
|
(28)
|
|
|
(29)
|
|
|
(113)
|
|
|
(152)
|
|
|
|
38
|
|
|
31
|
|
|
135
|
|
|
88
|
|
|
|
|
|
|
|
|
|
|
|
|
|
|
Gain (Loss) on Derivatives
|
|
|
127
|
|
|
(311)
|
|
|
422
|
|
|
(339)
|
|
Loss on Early Extinguishment of Debt
|
|
|
–
|
|
|
–
|
|
|
(70)
|
|
|
(51)
|
|
Other Income, Net
|
|
|
(1)
|
|
|
1
|
|
|
5
|
|
|
1
|
|
|
|
|
|
|
|
|
|
|
|
|
|
|
Income (Loss) Before Income Taxes
|
|
|
255
|
|
|
(219)
|
|
|
953
|
|
|
(2,672)
|
|
Benefit for Income Taxes
|
|
|
|
|
|
|
|
|
|
|
|
|
|
Current
|
|
|
(12)
|
|
|
(7)
|
|
|
(22)
|
|
|
(7)
|
|
Deferred
|
|
|
(67)
|
|
|
(2)
|
|
|
(71)
|
|
|
(22)
|
|
|
|
(79)
|
|
|
(9)
|
|
|
(93)
|
|
|
(29)
|
|
Net Income (Loss)
|
|
|
334
|
|
|
(210)
|
|
|
1,046
|
|
|
(2,643)
|
|
Mandatory convertible preferred stock dividend
|
|
|
27
|
|
|
27
|
|
|
108
|
|
|
108
|
|
Participating securities - mandatory convertible preferred stock
|
|
|
40
|
|
|
–
|
|
|
123
|
|
|
–
|
|
Net Income (Loss) Attributable to Common Stock
|
|
$
|
267
|
|
$
|
(237)
|
|
$
|
815
|
|
$
|
(2,751)
|
|
|
|
|
|
|
|
|
|
|
|
|
|
|
Income (Loss) Per Common Share
|
|
|
|
|
|
|
|
|
|
|
|
|
|
Basic
|
|
$
|
0.53
|
|
$
|
(0.48)
|
|
$
|
1.64
|
|
$
|
(6.32)
|
|
Diluted
|
|
$
|
0.53
|
|
$
|
(0.48)
|
|
$
|
1.63
|
|
$
|
(6.32)
|
|
Weighted Average Common Shares Outstanding
|
|
Basic
|
|
503,614,377
|
|
489,287,827
|
|
498,264,321
|
|
435,337,402
|
|
Diluted
|
|
507,137,867
|
|
489,287,827
|
|
500,804,297
|
|
435,337,402
|
|
|
|
|
|
|
|
|
BALANCE SHEETS (Unaudited)
|
|
|
Southwestern Energy Company and Subsidiaries
|
|
|
|
|
|
|
|
|
|
|
|
|
|
|
December 31,
2017
|
|
December 31,
2016
|
|
|
(in millions)
|
|
ASSETS
|
|
|
|
|
|
|
|
Current assets
|
|
$
|
1,509
|
|
$
|
1,872
|
|
Property and equipment
|
|
|
25,769
|
|
|
24,489
|
|
Less: Accumulated depreciation, depletion and amortization
|
|
|
(19,997)
|
|
|
(19,534)
|
|
Total property and equipment, net
|
|
|
5,772
|
|
|
4,955
|
|
Other long-term assets
|
|
|
240
|
|
|
249
|
|
Total assets
|
|
$
|
7,521
|
|
$
|
7,076
|
|
|
|
|
|
|
|
|
LIABILITIES AND EQUITY
|
|
|
|
|
|
|
|
Current liabilities
|
|
$
|
780
|
|
$
|
1,064
|
|
Long-term debt
|
|
|
4,391
|
|
|
4,612
|
|
Pension and other postretirement liabilities
|
|
|
58
|
|
|
49
|
|
Other long-term liabilities
|
|
|
313
|
|
|
434
|
|
Total liabilities
|
|
|
5,542
|
|
|
6,159
|
|
Equity:
|
|
|
|
|
|
|
|
Common stock, $0.01 par value; 1,250,000,000 shares authorized; issued 512,134,311 shares as of December 31, 2017 and 495,248,369 as of December 31, 2016
|
|
|
5
|
|
|
5
|
|
Preferred stock, $0.01 par value, 10,000,000 shares authorized, 6.25% Series B Mandatory Convertible, $1,000 per share liquidation preference, 1,725,000 shares issued and outstanding as of December 31, 2017 and 2016, converted to common stock in January 2018
|
|
|
–
|
|
|
–
|
|
Additional paid-in capital to common stock
|
|
|
4,698
|
|
|
4,677
|
|
Accumulated deficit
|
|
|
(2,679)
|
|
|
(3,725)
|
|
Accumulated other comprehensive loss
|
|
|
(44)
|
|
|
(39)
|
|
Common stock in treasury; 31,269 shares as of December 31, 2017 and 2016
|
|
|
(1)
|
|
|
(1)
|
|
Total equity
|
|
|
1,979
|
|
|
917
|
|
Total liabilities and equity
|
|
$
|
7,521
|
|
$
|
7,076
|
|
|
|
|
|
|
|
|
STATEMENTS OF CASH FLOWS (Unaudited)
|
|
|
Southwestern Energy Company and Subsidiaries
|
|
|
|
|
|
|
|
For the years ended
|
|
|
December 31,
|
|
|
2017
|
|
2016
|
|
|
(in millions)
|
|
Cash Flows From Operating Activities:
|
|
|
|
|
|
|
|
Net income (loss)
|
|
$
|
1,046
|
|
$
|
(2,643)
|
|
Adjustments to reconcile net income (loss) to net cash provided by operating activities:
|
|
|
|
|
|
|
|
Depreciation, depletion and amortization
|
|
|
504
|
|
|
436
|
|
Impairment of natural gas and oil properties
|
|
|
–
|
|
|
2,321
|
|
Amortization of debt issuance costs
|
|
|
9
|
|
|
14
|
|
Deferred income taxes
|
|
|
(71)
|
|
|
(22)
|
|
(Gain) loss on derivatives, net of settlement
|
|
|
(451)
|
|
|
373
|
|
Stock-based compensation
|
|
|
24
|
|
|
29
|
|
Gain on sales of assets, net
|
|
|
(6)
|
|
|
–
|
|
Restructuring charges
|
|
|
–
|
|
|
30
|
|
Loss on early extinguishment of debt
|
|
|
70
|
|
|
51
|
|
Other
|
|
|
13
|
|
|
8
|
|
Change in assets and liabilities
|
|
|
(41)
|
|
|
(99)
|
|
Net cash provided by operating activities
|
|
|
1,097
|
|
|
498
|
|
|
|
|
|
|
|
|
Cash Flows From Investing Activities:
|
|
|
|
|
|
|
|
Capital investments
|
|
|
(1,268)
|
|
|
(593)
|
|
Proceeds from sale of property and equipment
|
|
|
10
|
|
|
430
|
|
Other
|
|
|
6
|
|
|
1
|
|
Net cash used in investing activities
|
|
|
(1,252)
|
|
|
(162)
|
|
|
|
|
|
|
|
|
Cash Flows From Financing Activities:
|
|
|
|
|
|
|
|
Payments on current portion of long-term debt
|
|
|
(328)
|
|
|
(1)
|
|
Payments on long-term debt
|
|
|
(1,139)
|
|
|
(1,175)
|
|
Payments on revolving credit facility
|
|
|
–
|
|
|
(3,268)
|
|
Borrowings under revolving credit facility
|
|
|
–
|
|
|
3,152
|
|
Payments on commercial paper
|
|
|
–
|
|
|
(242)
|
|
Borrowings under commercial paper
|
|
|
–
|
|
|
242
|
|
Change in bank drafts outstanding
|
|
|
9
|
|
|
(20)
|
|
Proceeds from issuance of long-term debt
|
|
|
1,150
|
|
|
1,191
|
|
Payment of debt issuance costs
|
|
|
(24)
|
|
|
(17)
|
|
Proceeds from issuance of common stock
|
|
|
–
|
|
|
1,247
|
|
Preferred stock dividend
|
|
|
(16)
|
|
|
(27)
|
|
Cash paid for tax withholding
|
|
|
(2)
|
|
|
(9)
|
|
Other
|
|
|
(2)
|
|
|
(1)
|
|
Net cash provided by (used in) financing activities
|
|
|
(352)
|
|
|
1,072
|
|
|
|
|
|
|
|
|
Increase (decrease) in cash and cash equivalents
|
|
|
(507)
|
|
|
1,408
|
|
Cash and cash equivalents at beginning of year
|
|
|
1,423
|
|
|
15
|
|
Cash and cash equivalents at end of year
|
|
$
|
916
|
|
$
|
1,423
|
|
|
|
|
|
|
|
|
|
|
|
|
|
|
|
|
|
SEGMENT INFORMATION (Unaudited)
|
|
|
Southwestern Energy Company and Subsidiaries
|
|
Exploration
|
|
|
|
|
|
|
|
|
|
|
|
|
|
and
|
|
Midstream
|
|
|
|
|
|
|
|
|
|
|
(in millions)
|
|
Production
|
|
Services
|
|
Other
|
|
Eliminations
|
|
Total
|
|
Three months ended December 31, 2017
|
|
|
|
|
|
|
|
|
|
|
|
|
|
|
|
|
Revenues
|
|
$
|
527
|
|
$
|
784
|
|
$
|
–
|
|
$
|
(502)
|
|
$
|
809
|
|
Marketing purchases
|
|
|
–
|
|
|
683
|
|
|
–
|
|
|
(447)
|
|
|
236
|
|
Operating expenses
|
|
|
218
|
|
|
24
|
|
|
–
|
|
|
(55)
|
|
|
187
|
|
General and administrative expenses
|
|
|
55
|
|
|
8
|
|
|
–
|
|
|
–
|
|
|
63
|
|
Depreciation, depletion and amortization
|
|
|
123
|
|
|
17
|
|
|
–
|
|
|
–
|
|
|
140
|
|
Taxes, other than income taxes
|
|
|
17
|
|
|
1
|
|
|
1
|
|
|
–
|
|
|
19
|
|
Gain on sale of assets, net
|
|
|
–
|
|
|
(3)
|
|
|
–
|
|
|
–
|
|
|
(3)
|
|
Operating income (loss)
|
|
|
114
|
|
|
54
|
|
|
(1)
|
|
|
–
|
|
|
167
|
|
Capital investments(1)
|
|
|
327
|
|
|
11
|
|
|
9
|
|
|
–
|
|
|
347
|
|
|
|
|
|
|
|
|
|
|
|
|
|
|
|
|
|
Three months ended December 31, 2016
|
|
|
|
|
|
|
|
|
|
|
|
|
|
|
|
|
Revenues
|
|
$
|
415
|
|
$
|
707
|
|
$
|
–
|
|
$
|
(438)
|
|
$
|
684
|
|
Marketing purchases
|
|
|
–
|
|
|
612
|
|
|
–
|
|
|
(375)
|
|
|
237
|
|
Operating expenses
|
|
|
175
|
|
|
25
|
|
|
–
|
|
|
(63)
|
|
|
137
|
|
General and administrative expenses
|
|
|
63
|
|
|
13
|
|
|
–
|
|
|
–
|
|
|
76
|
|
Restructuring charges
|
|
|
1
|
|
|
–
|
|
|
–
|
|
|
–
|
|
|
1
|
|
Depreciation, depletion and amortization
|
|
|
71
|
|
|
16
|
|
|
–
|
|
|
–
|
|
|
87
|
|
Taxes, other than income taxes
|
|
|
23
|
|
|
1
|
|
|
–
|
|
|
–
|
|
|
24
|
|
Operating income
|
|
|
82
|
|
|
40
|
|
|
–
|
|
|
–
|
|
|
122
|
|
Capital investments(1)
|
|
|
251
|
|
|
18
|
|
|
3
|
|
|
–
|
|
|
272
|
|
|
|
|
|
|
|
|
|
|
|
|
|
|
|
|
|
Twelve months ended December 31, 2017
|
|
|
|
|
|
|
|
|
|
|
|
|
|
|
|
|
Revenues
|
|
$
|
2,086
|
|
$
|
3,198
|
|
$
|
–
|
|
$
|
(2,081)
|
|
$
|
3,203
|
|
Marketing purchases
|
|
|
–
|
|
|
2,824
|
|
|
–
|
|
|
(1,848)
|
|
|
976
|
|
Operating expenses
|
|
|
809
|
|
|
95
|
|
|
–
|
|
|
(233)
|
|
|
671
|
|
General and administrative expenses
|
|
|
202
|
|
|
31
|
|
|
–
|
|
|
–
|
|
|
233
|
|
Depreciation, depletion and amortization
|
|
|
440
|
|
|
64
|
|
|
–
|
|
|
–
|
|
|
504
|
|
Gain on sale of asset, net
|
|
|
–
|
|
|
(6)
|
|
|
–
|
|
|
–
|
|
|
(6)
|
|
Taxes, other than income taxes
|
|
|
86
|
|
|
7
|
|
|
1
|
|
|
–
|
|
|
94
|
|
Operating income (loss)
|
|
|
549
|
|
|
183
|
|
|
(1)
|
|
|
–
|
|
|
731
|
|
Capital investments(1)
|
|
|
1,248
|
|
|
32
|
|
|
13
|
|
|
–
|
|
|
1,293
|
|
|
|
|
|
|
|
|
|
|
|
|
|
|
|
|
|
Twelve months ended December 31, 2016
|
|
|
|
|
|
|
|
|
|
|
|
|
|
|
|
|
Revenues
|
|
$
|
1,413
|
|
$
|
2,569
|
|
$
|
–
|
|
$
|
(1,546)
|
|
$
|
2,436
|
|
Marketing purchases
|
|
|
–
|
|
|
2,145
|
|
|
–
|
|
|
(1,281)
|
|
|
864
|
|
Operating expenses
|
|
|
761
|
|
|
96
|
|
|
–
|
|
|
(265)
|
|
|
592
|
|
General and administrative expenses
|
|
|
204
|
|
|
43
|
|
|
–
|
|
|
–
|
|
|
247
|
|
Restructuring charges
|
|
|
75
|
|
|
3
|
|
|
–
|
|
|
–
|
|
|
78
|
|
Depreciation, depletion and amortization
|
|
|
371
|
|
|
65
|
|
|
–
|
|
|
–
|
|
|
436
|
|
Impairment of natural gas and oil properties
|
|
|
2,321
|
|
|
–
|
|
|
–
|
|
|
–
|
|
|
2,321
|
|
Taxes, other than income taxes
|
|
|
85
|
|
|
8
|
|
|
–
|
|
|
–
|
|
|
93
|
|
Operating income (loss)
|
|
|
(2,404)
|
|
|
209
|
|
|
–
|
|
|
–
|
|
|
(2,195)
|
|
Capital investments(1)
|
|
|
623
|
|
|
21
|
|
|
4
|
|
|
–
|
|
|
648
|
|
|
|
(1)
|
Capital investments includes increases of $13 million and $67 million for the three months ended December 31, 2017 and 2016, respectively, and an increase of $43 million for the year ended December 31, 2016 relating to the change in accrued expenditures between periods. There was no impact to the year ended December 31, 2017.
|
 View original content with multimedia:http://www.prnewswire.com/news-releases/southwestern-energy-announces-2017-operational-and-financial-results-300607044.html View original content with multimedia:http://www.prnewswire.com/news-releases/southwestern-energy-announces-2017-operational-and-financial-results-300607044.html
SOURCE Southwestern Energy Company

Source: PR Newswire
(March 1, 2018 - 4:15 PM EST)
News by QuoteMedia
www.quotemedia.com
|


