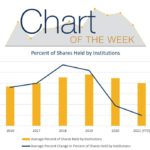
Chart of the Week: Retail vs. Institutional Investors in Energy
By Andrew Nichols: EnerCom Traditionally, individuals make their investments by hiring a professional organization to manage their money in the market and make decisions on their behalf. Institutional investing is not the only way to buy into the market though. Recently, there has been an increase in retail investors, who are non-professional investors that buy and sell securities on their