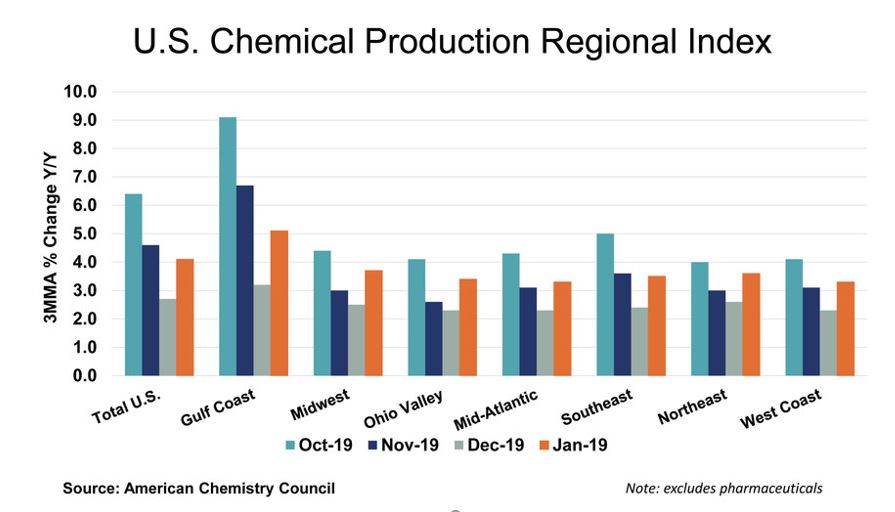
According to the American Chemistry Council (ACC), the U.S. Chemical Production Regional Index (U.S. CPRI) rose by 0.3 percent in January, following a 0.6 percent gain in December and a 0.2 percent gain in November. During January, chemical output rose across all regions, with the largest gains in the Gulf Coast region.
Chemical production was mixed over the three-month period. There were gains in the production three-month moving average output trend in inorganic chemicals, plastic resins, synthetic dyes & pigments, and other specialty chemicals. These gains were offset by declines in the output of fertilizers synthetic rubber, consumer products, manufactured fibers, adhesives, pesticides and coatings.
Nearly all manufactured goods are produced using chemistry in some form. Thus, manufacturing activity is an important indicator for chemical production. On a three-month-moving average basis, manufacturing activity rose by 0.2 percent in January, following a 0.3 percent gain in December. Output expanded in several chemistry-intensive manufacturing industries, including appliances, aerospace, construction supplies, fabricated metal products, computers & electronics, petroleum refining, iron and steel products, oil & gas extraction, plastic products, rubber products, tires, structural panels, and furniture.
Compared with January 2018, U.S. chemical production was up by 4.1 percent on a year-over-year basis, an improvement as compared with last month. Chemical production was higher than a year ago in all regions, with the largest gains in the Gulf Coast and Midwest regions.
| U.S. Chemical Production Regional Index, Percentage Change
(Seasonally adjusted, 3-month moving average) |
|||||
| Jan 19/ Dec 18 |
Jan 19/ Jan 18 |
Key products | |||
| Gulf Coast | 0.5% | 5.1% | petrochemicals, inorganics, plastics resins, and synthetic rubber | ||
| Midwest | 0.2% | 3.7% | agricultural chemicals, plastics, and paints | ||
| Ohio Valley | 0.2% | 3.4% | organic chemicals, plastics and synthetic materials, and specialty chemicals | ||
| Mid-Atlantic | 0.1% | 3.3% | consumer products | ||
| Southeast | 0.3% | 3.5% | inorganic chemicals, fibers, and consumer products | ||
| Northeast | 0.3% | 3.6% | consumer products and specialty chemicals | ||
| West Coast | 0.1% | 3.3% | basic chemicals, agricultural chemicals, and consumer products | ||
| U.S. Total | 0.3% | 4.1% | |||
[contextly_sidebar id=”MzMWdSQMBDPMvCsFwtxFmg1lWWBBzURI”]The chemistry industry is a $526 billion enterprise. The manufacturing sector is the largest consumer of chemical products, and 96 percent of manufactured goods are touched by chemistry. The U.S. CPRI was developed to track chemical production activity in seven regions of the United States. The U.S. CPRI is based on information from the Federal Reserve, and as such, includes monthly revisions as published by the Federal Reserve. To smooth month-to-month fluctuations, the U.S. CPRI is measured using a three-month moving average. Thus, the reading in January reflects production activity during November, December, and January.