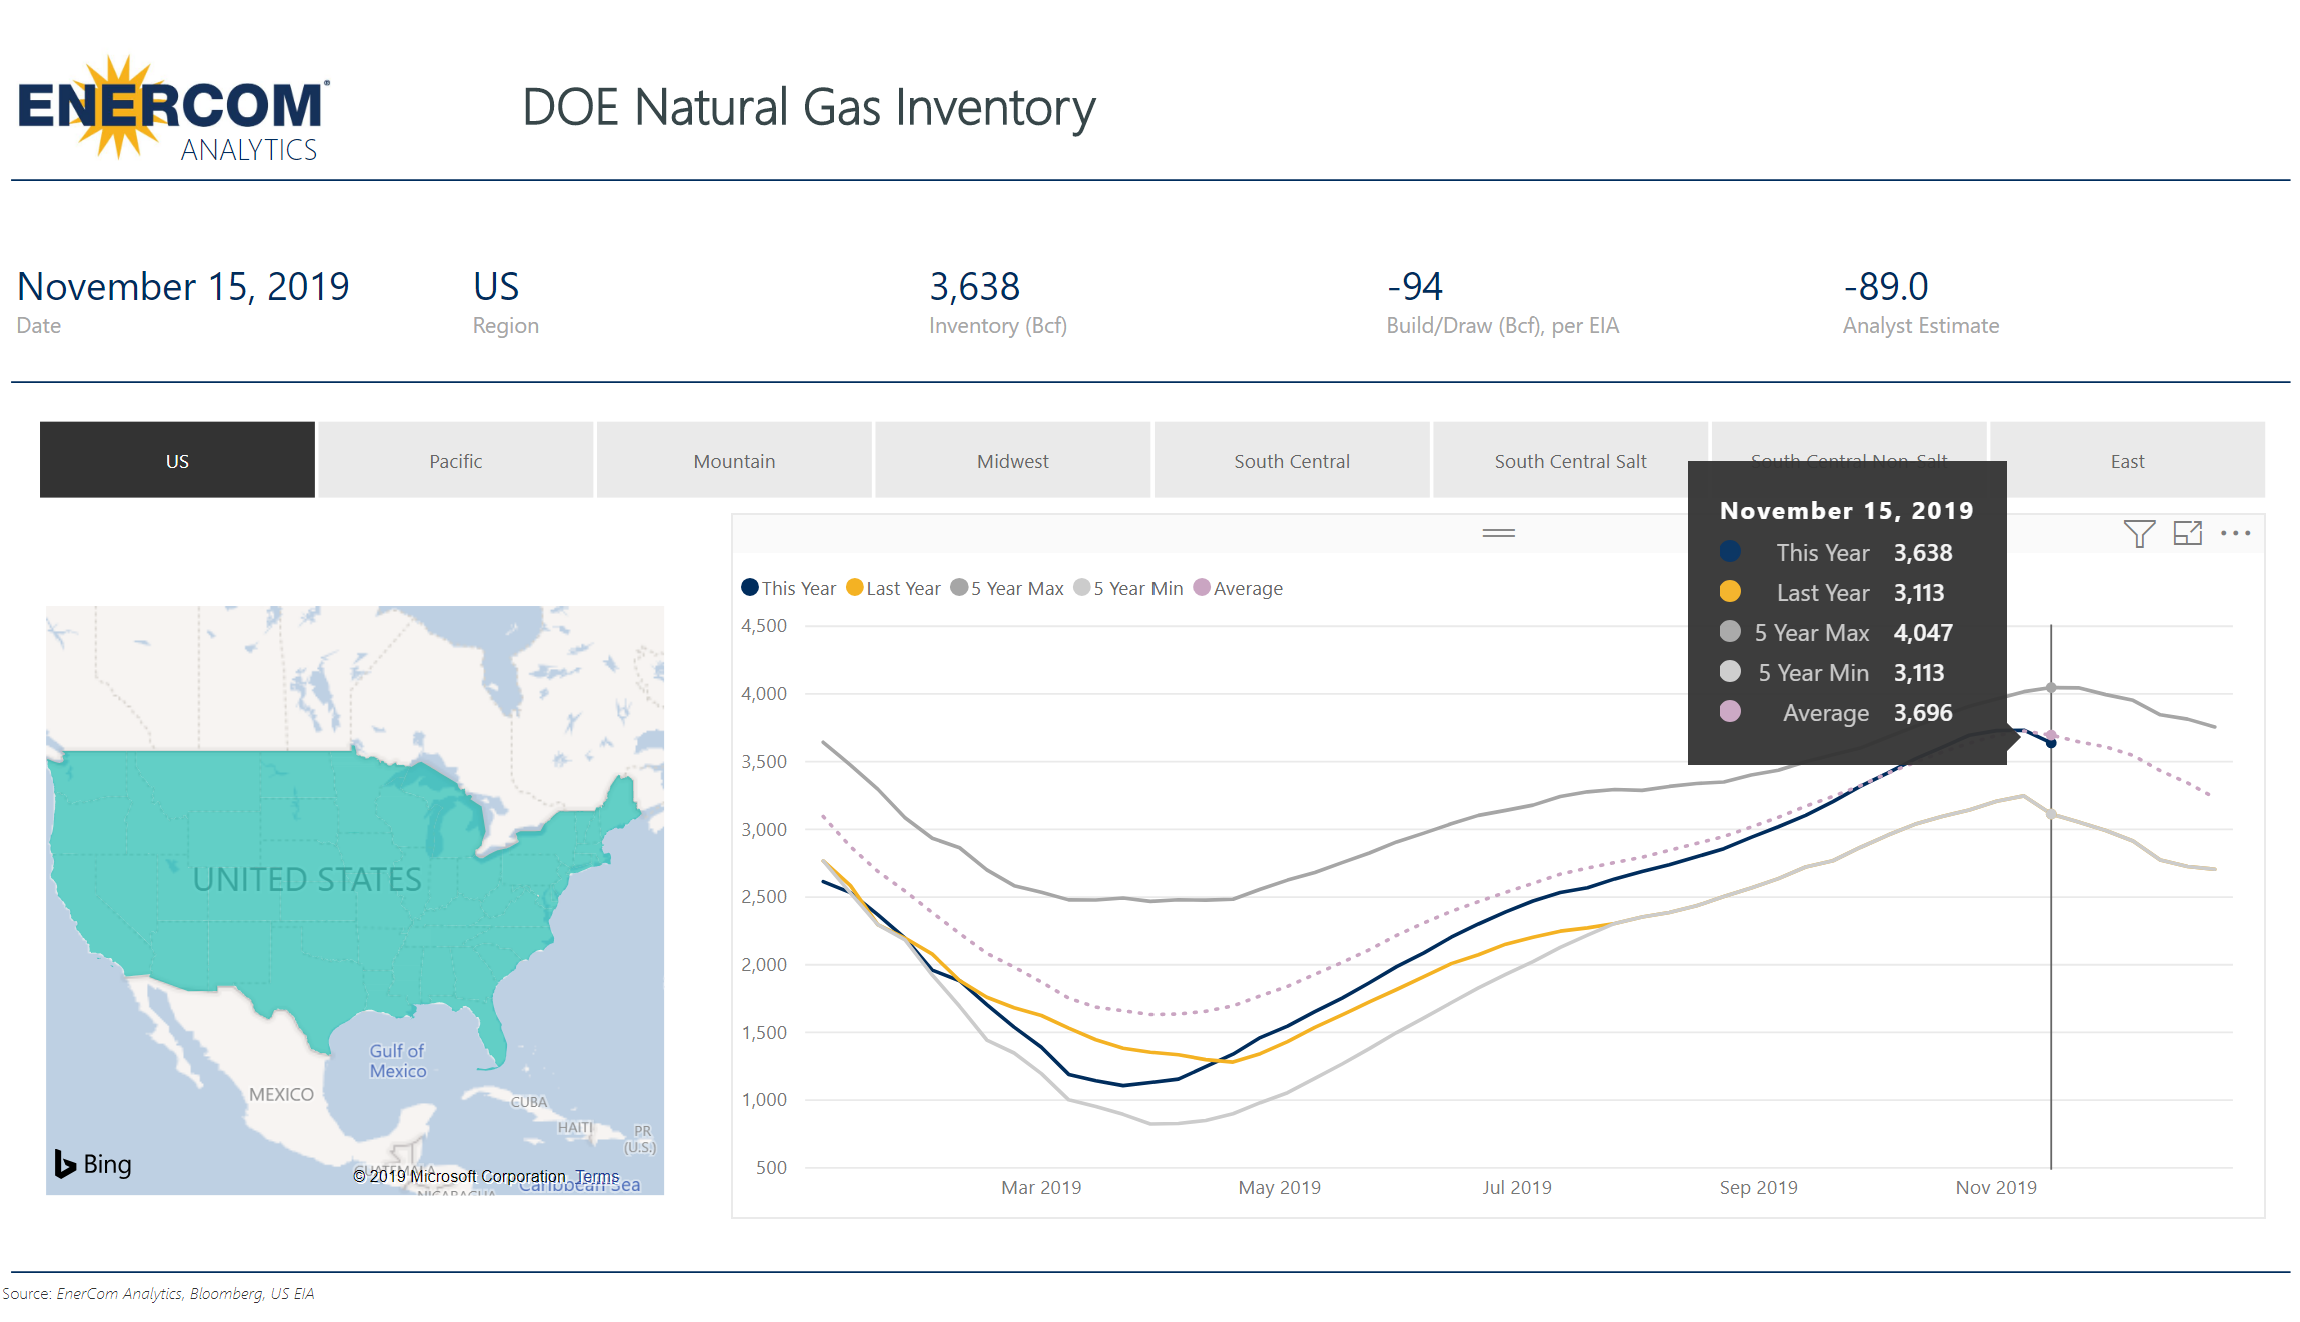
Natural Gas Inventories as of November 15, 2019
Working gas in storage was 3,638 Bcf as of Friday, November 15, 2019, according to EIA estimates. This represents a net decrease of 94 Bcf from the previous week. Stocks were 506 Bcf higher than last year at this time and 60 Bcf below the five-year average of 3,698 Bcf. At 3,638 Bcf, total working gas is within the five-year historical range.
Click the above image to view EnerCom’s interactive inventories dashboards
| Working gas in underground storage, Lower 48 states | |||||||||||||||||||||||||
|---|---|---|---|---|---|---|---|---|---|---|---|---|---|---|---|---|---|---|---|---|---|---|---|---|---|
| Historical Comparisons | |||||||||||||||||||||||||
| Stocks billion cubic feet (Bcf) |
Year ago (11/15/18) |
5-year average (2014-18) |
|||||||||||||||||||||||
| Region | 11/15/19 | 11/08/19 | net change | implied flow | Bcf | % change | Bcf | % change | |||||||||||||||||
| East | 909 | 932 | -23 | -23 | 808 | 12.5 | 893 | 1.8 | |||||||||||||||||
| Midwest | 1,069 | 1,106 | -37 | -37 | 964 | 10.9 | 1,076 | -0.7 | |||||||||||||||||
| Mountain | 205 | 207 | -2 | -2 | 175 | 17.1 | 210 | -2.4 | |||||||||||||||||
| Pacific | 292 | 290 | 2 | 2 | 259 | 12.7 | 326 | -10.4 | |||||||||||||||||
| South Central | 1,164 | 1,197 | -33 | -33 | 927 | 25.6 | 1,193 | -2.4 | |||||||||||||||||
| Salt | 299 | 313 | -14 | -14 | 254 | 17.7 | 339 | -11.8 | |||||||||||||||||
| Nonsalt | 864 | 884 | -20 | -20 | 673 | 28.4 | 854 | 1.2 | |||||||||||||||||
| Total | 3,638 | 3,732 | -94 | -94 | 3,132 | 16.2 | 3,698 | -1.6 | |||||||||||||||||
| Totals may not equal sum of components because of independent rounding. | |||||||||||||||||||||||||
All regions experienced a net draw this week with the exception of Pacific.
Stocks in every region except the East and Nonsalt are below the five-year average. The East region is the farthest above the five-year average, at 1.8% above the average.


