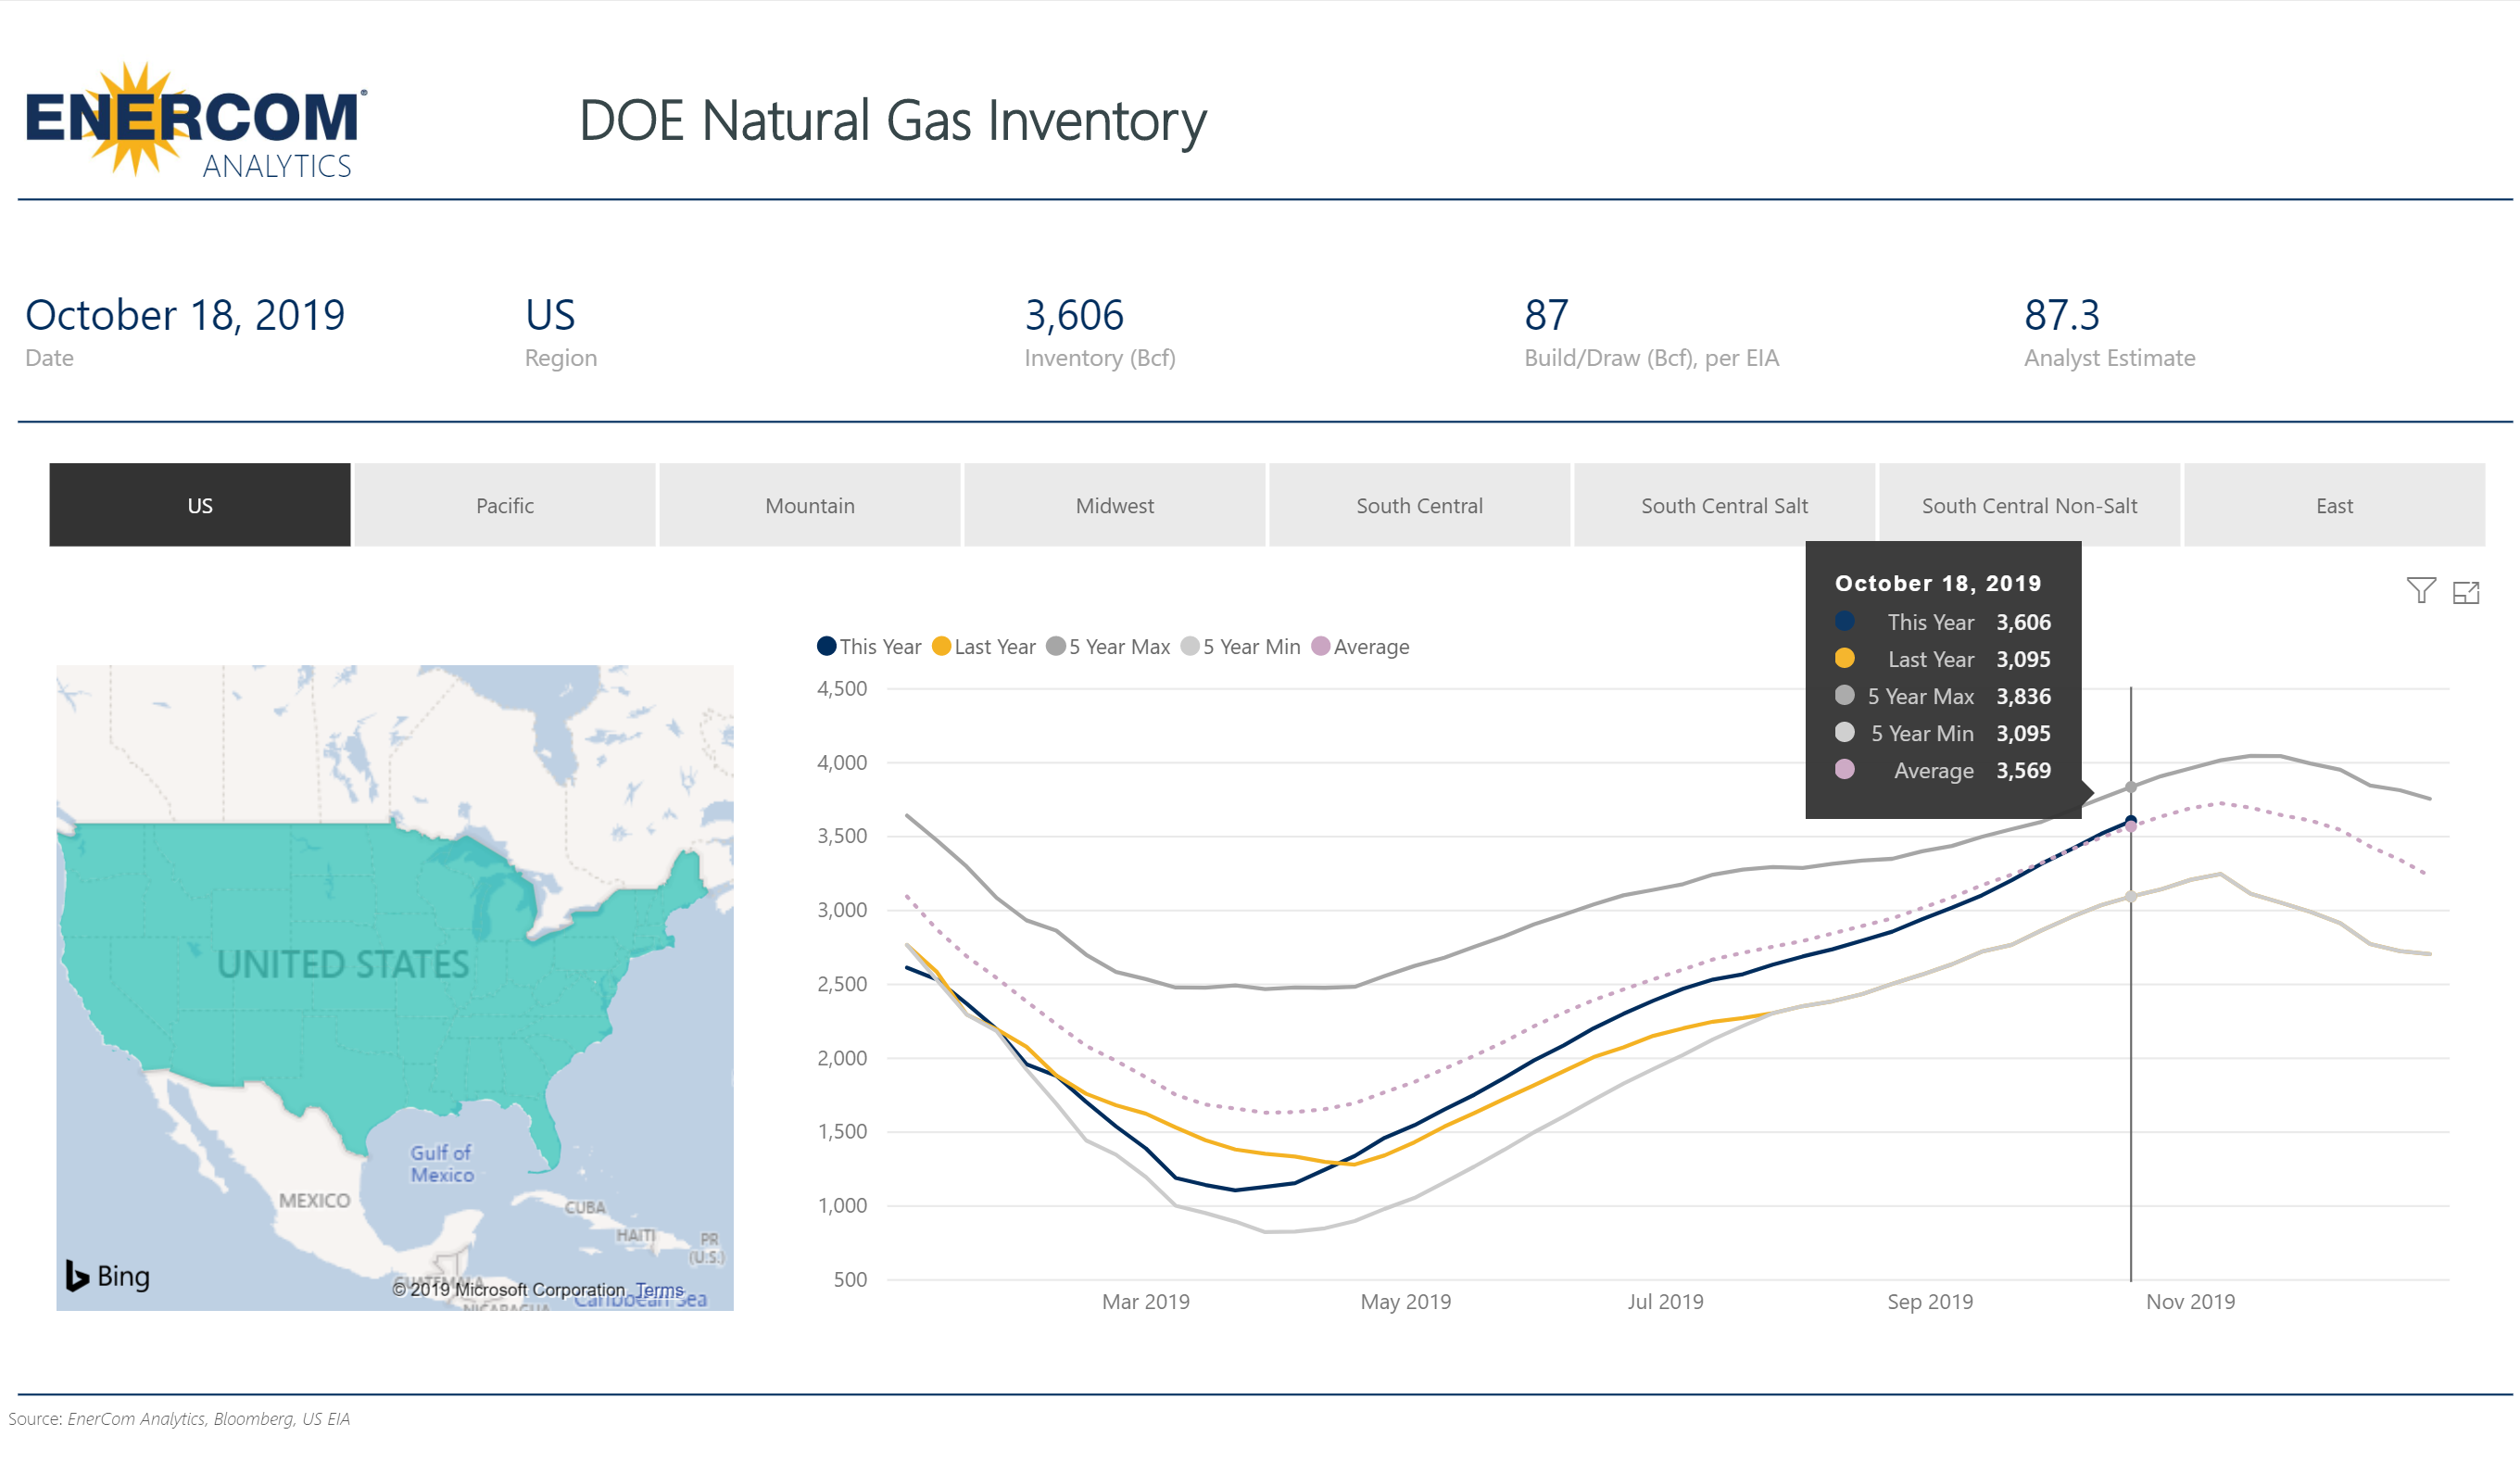
Natural Gas Inventories as of October 18, 2019
The EIA has released its natural gas inventory report, showing a build of 87 Bcf.
Working gas in storage was 3,606 Bcf as of Friday, October 18, 2019, according to EIA estimates. This represents a net increase of 87 Bcf from the previous week. Stocks were 519 Bcf higher than last year at this time and 28 Bcf above the five-year average of 3,578 Bcf.
At 3,606 Bcf, total working gas is within the five-year historical range.
Click the above image to view EnerCom’s interactive inventories dashboards
| Working gas in underground storage, Lower 48 states | |||||||||||||||||||||||||
|---|---|---|---|---|---|---|---|---|---|---|---|---|---|---|---|---|---|---|---|---|---|---|---|---|---|
| Historical Comparisons | |||||||||||||||||||||||||
| Stocks billion cubic feet (Bcf) |
Year ago (10/18/18) |
5-year average (2014-18) |
|||||||||||||||||||||||
| Region | 10/18/19 | 10/11/19 | net change | implied flow | Bcf | % change | Bcf | % change | |||||||||||||||||
| East | 898 | 880 | 18 | 18 | 823 | 9.1 | 886 | 1.4 | |||||||||||||||||
| Midwest | 1,069 | 1,044 | 25 | 25 | 930 | 14.9 | 1,034 | 3.4 | |||||||||||||||||
| Mountain | 208 | 205 | 3 | 3 | 177 | 17.5 | 209 | -0.5 | |||||||||||||||||
| Pacific | 297 | 296 | 1 | 1 | 262 | 13.4 | 322 | -7.8 | |||||||||||||||||
| South Central | 1,134 | 1,093 | 41 | 41 | 893 | 27.0 | 1,129 | 0.4 | |||||||||||||||||
| Salt | 268 | 246 | 22 | 22 | 216 | 24.1 | 303 | -11.6 | |||||||||||||||||
| Nonsalt | 866 | 847 | 19 | 19 | 677 | 27.9 | 825 | 5.0 | |||||||||||||||||
| Total | 3,606 | 3,519 | 87 | 87 | 3,087 | 16.8 | 3,578 | 0.8 | |||||||||||||||||
| Totals may not equal sum of components because of independent rounding. | |||||||||||||||||||||||||
All regions experienced a net increase this week.
Stocks in every region except the East, Midwest, and South Central nonsalt are below the five-year average. The salt count in the South Central region is the farthest below the five-year average, at 11.6% below the average.


