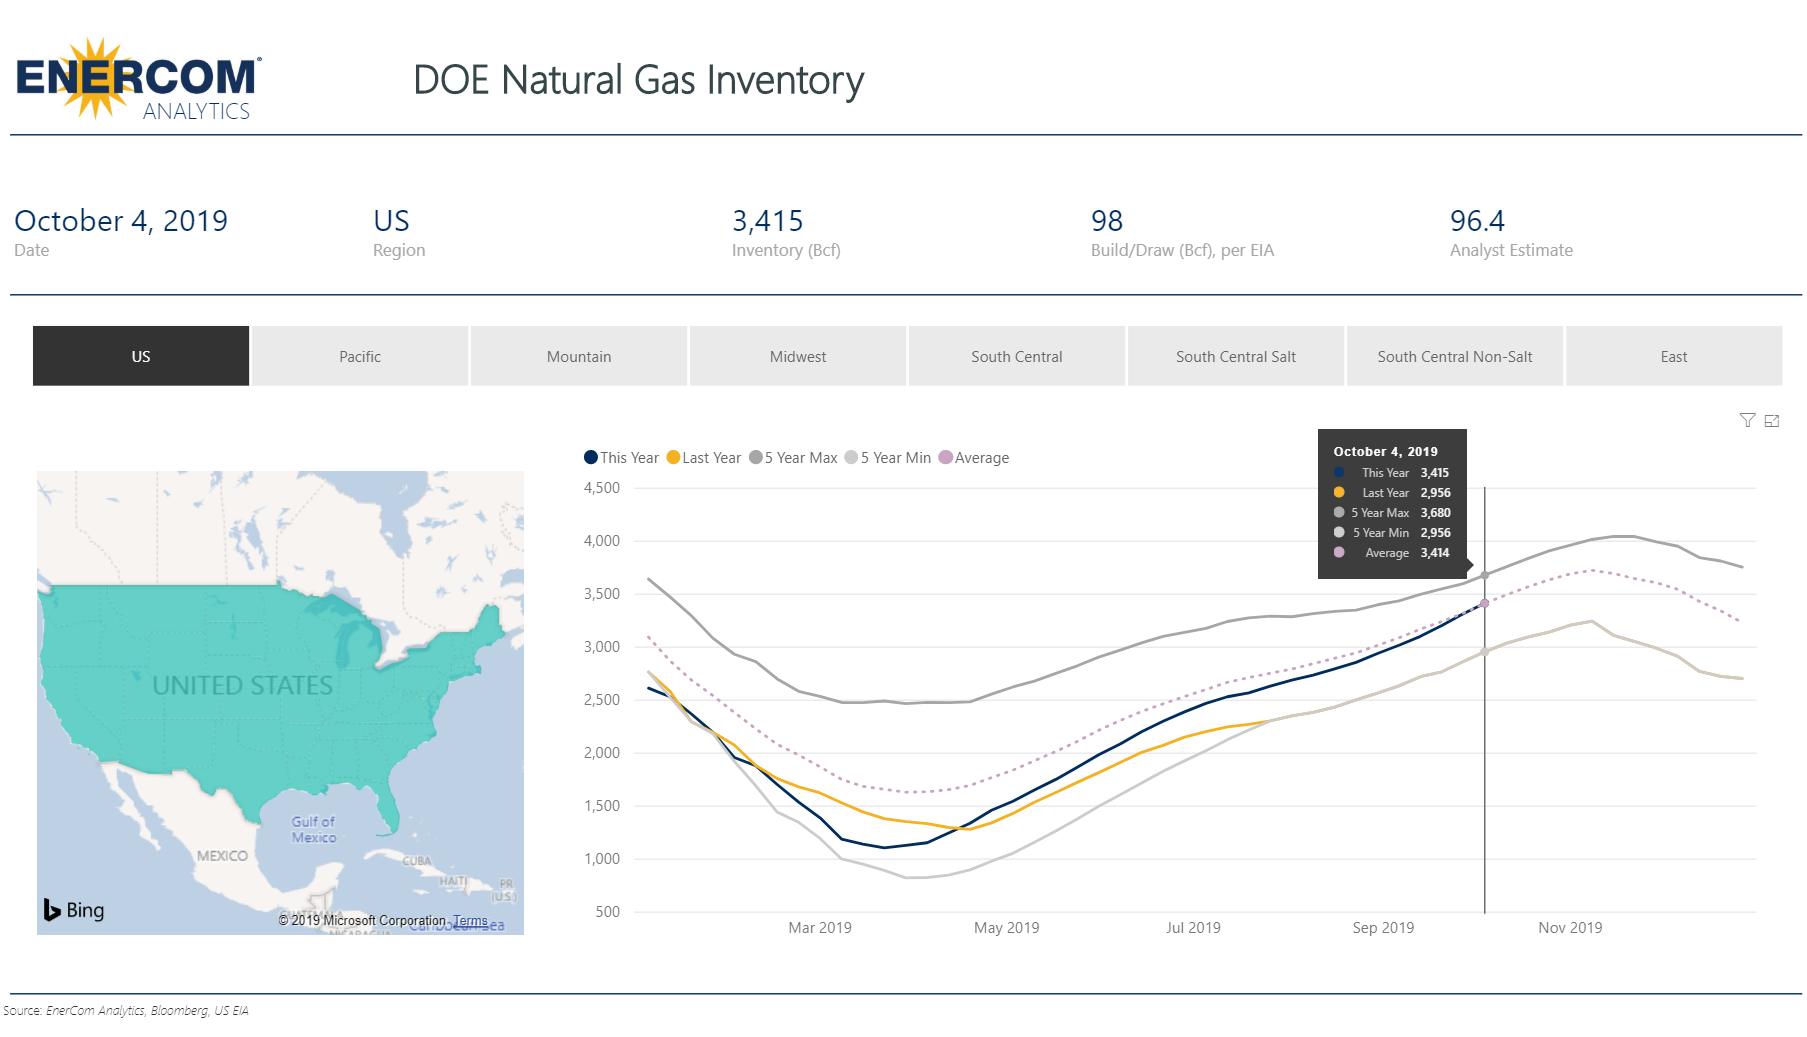
Natural Gas Inventories as of October 4, 2019
The EIA has released its natural gas inventory report, showing another build of 98 Bcf as of October 4.
Working gas in storage was 3,415 Bcf as of Friday, October 4, 2019, according to EIA estimates. This represents a net increase of 98 Bcf from the previous week. Stocks were 472 Bcf higher than last year at this time and 9 Bcf below the five-year average of 3,424 Bcf. At 3,415 Bcf, total working gas is within the five-year historical range.
By region
All regions experienced a net increase this week. Stocks in every region except the East, Midwest and South Central Nonsalt are below the five-year average. The salt count in the South Central region is the farthest below the five-year average, at 17.6% below the average.
| Working gas in underground storage, Lower 48 states | |||||||||||||||||||||||||
|---|---|---|---|---|---|---|---|---|---|---|---|---|---|---|---|---|---|---|---|---|---|---|---|---|---|
| Historical Comparisons | |||||||||||||||||||||||||
| Stocks billion cubic feet (Bcf) |
Year ago (10/04/18) |
5-year average (2014-18) |
|||||||||||||||||||||||
| Region | 10/04/19 | 09/27/19 | net change | implied flow | Bcf | % change | Bcf | % change | |||||||||||||||||
| East | 854 | 826 | 28 | 28 | 786 | 8.7 | 852 | 0.2 | |||||||||||||||||
| Midwest | 1,009 | 973 | 36 | 36 | 866 | 16.5 | 977 | 3.3 | |||||||||||||||||
| Mountain | 203 | 199 | 4 | 4 | 180 | 12.8 | 205 | -1.0 | |||||||||||||||||
| Pacific | 296 | 291 | 5 | 5 | 262 | 13.0 | 316 | -6.3 | |||||||||||||||||
| South Central | 1,054 | 1,029 | 25 | 25 | 850 | 24.0 | 1,074 | -1.9 | |||||||||||||||||
| Salt | 229 | 220 | 9 | 9 | 190 | 20.5 | 278 | -17.6 | |||||||||||||||||
| Nonsalt | 825 | 809 | 16 | 16 | 661 | 24.8 | 796 | 3.6 | |||||||||||||||||
| Total | 3,415 | 3,317 | 98 | 98 | 2,943 | 16.0 | 3,424 | -0.3 | |||||||||||||||||
| Totals may not equal sum of components because of independent rounding. | |||||||||||||||||||||||||