The first session of this week was undoubtedly dominated by the sellers. Thanks to their sharp attack, black gold lost over 4%, making oil bears’ short positions even more profitable. Will it still be possible to earn money on crude oil in the coming week?
Technical Picture of Crude Oil
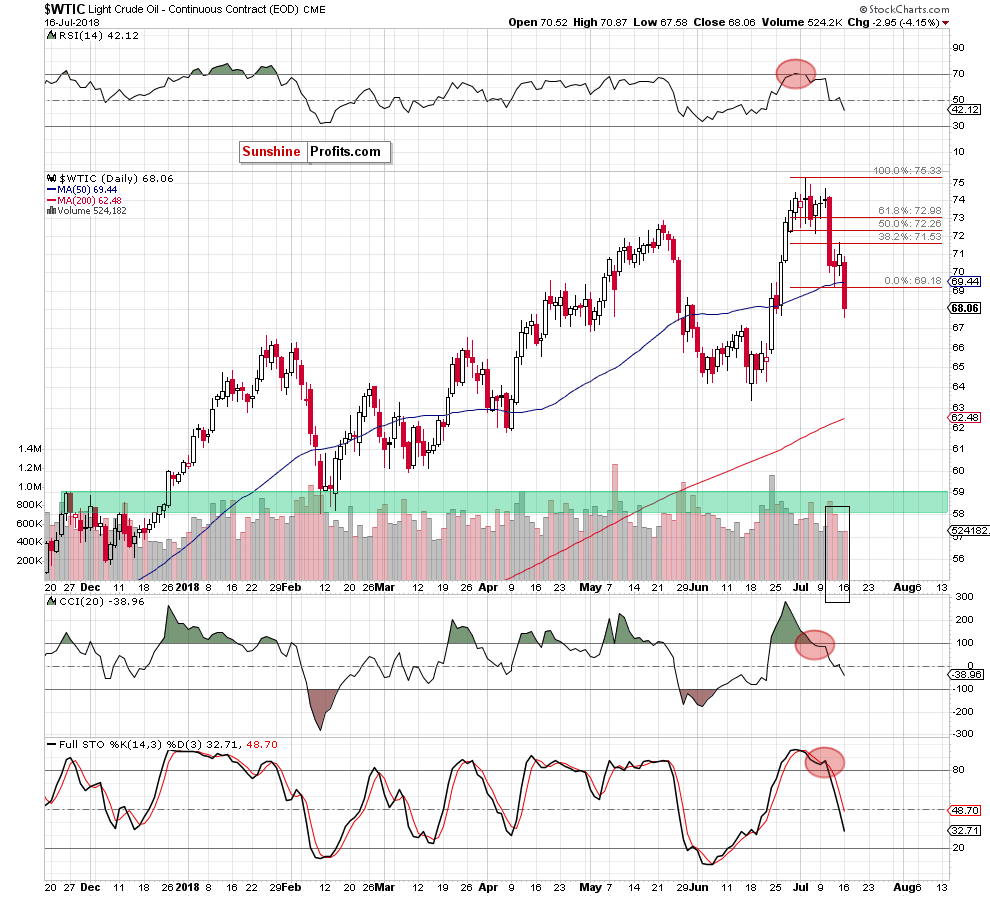
Yesterday, we noticed that although crude oil extended gains on Friday, the size of rebound was quite tiny, because light crude increased only to the 38.2% Fibonacci retracement.
After this move, the commodity pulled back, which didn’t confirm oil bulls’ strength – especially when we factor in Friday’s volume that was much lower than during earlier declines. Additionally, the sell signals generated by the indicators remain in the cards, supporting oil bears and further deterioration in the coming week.
The pro-bearish scenario was also reinforced by the long-term picture and our interesting ratios about which you could read in our essay published on July 6, 2018 (Crude Oil and Its Another Interesting Relationship)
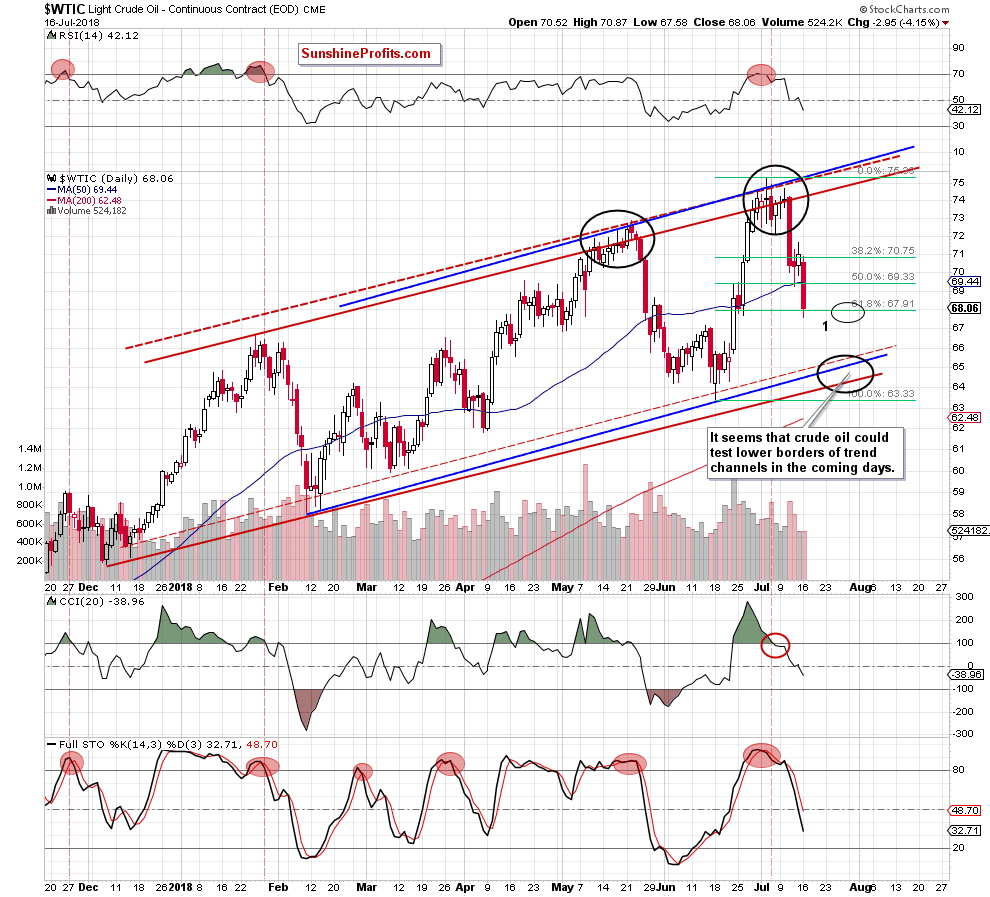
Therefore, we assumed in yesterday's alert that if black gold extends losses from Friday’s levels, oil bears will not only test the nearest support area (created by the recent low, 50% retracement and the 50-day moving average), but also push the price of crude oil to (at least) around $67.91-$68, where the 61.8% Fibonacci retracement and late June lows are.
From today’s point of view, we see that the situation developed in tune with our scenario and crude oil moved sharply lower, hitting a fresh July low and reaching our first downside target.
What’s next?
Taking into account the size of yesterday’s downswing and combining it with the sell signals generated by all daily indicators, we believe that further deterioration in the following days should not surprise us.
Therefore, if black gold drops under yesterday’s low, we’ll likely see a decline to around $65 and a test of lower borders of the rising trend channels in the near future (we marked this area with the black ellipse on the daily chart).
What’s interesting, the pro-bearish scenario is also reinforced by the current relationship between crude oil and platinum about which our subscribers could read in our Oil Trading Alert posted on July 12:
Crude Oil – For the First Time Ever
(…) the long-term picture of this interesting relationship.
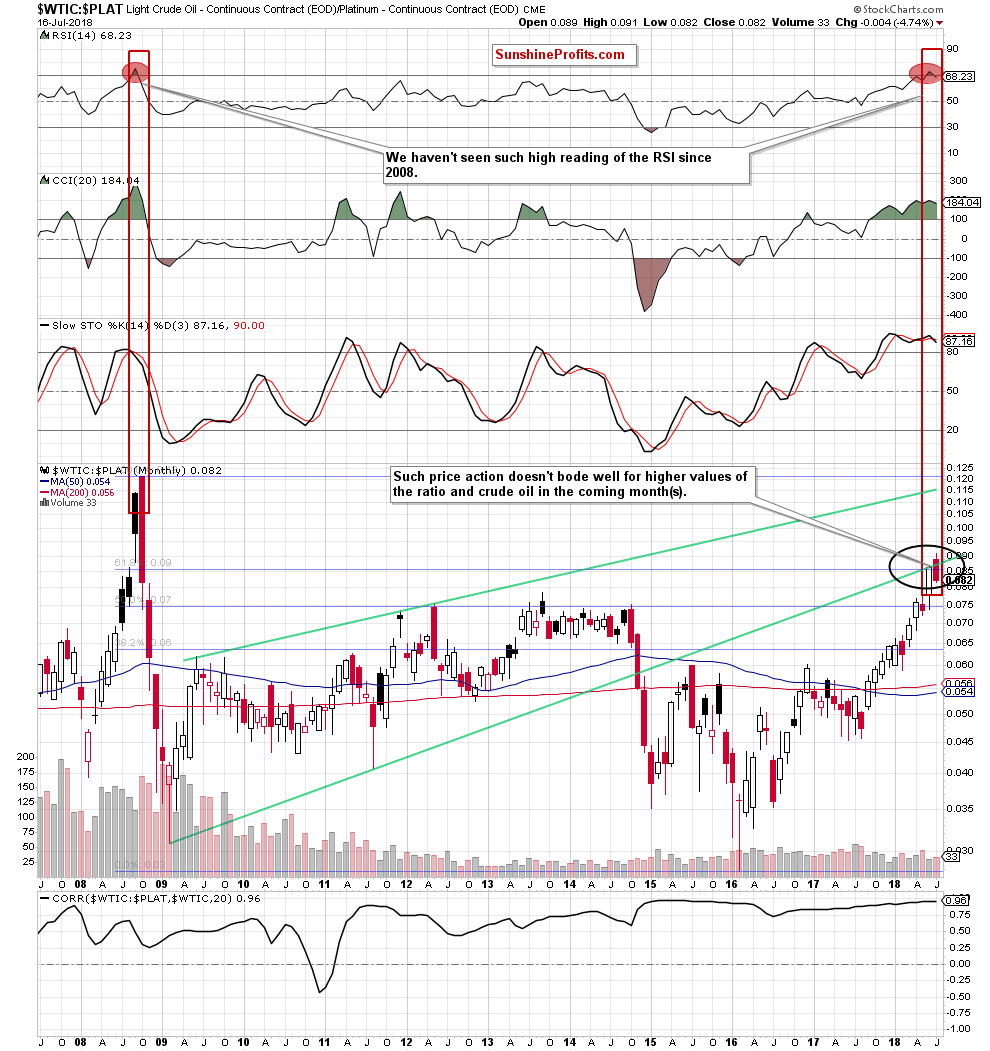
(…) although the WTIC:PLAT ratio extended gains earlier this month, the previously-broken lower border of the very long-term green rising wedge stopped the buyers, triggering a pullback.
Mainly thanks to yesterday's decline, the ratio invalidated the earlier small breakout above this resistance line and the June’s high, giving the sellers one more reason to act. Additionally, thanks to this drop, the ratio also declined under the previously-broken 61.8% Fibonacci retracement, invalidating also this breakout, which doesn’t bode well for higher values of the ratio.
As you see on the monthly chart, last week’s invalidation of the breakouts encouraged the sellers to act, which triggered further deterioration not only in the ratio, but also in crude oil (in line with our assumptions), making our short positions even more profitable.
The current correlation between the ratio and the price of black gold in the long term remains very high (0.96), which means that further deterioration in the ratio will be also seen in the case of crude oil in the coming month(s).
Why do we think it will go down?
Because all negative factors from the previous week remain in the cards, supporting the sellers:
Firstly, all (…) invalidations of the earlier breakouts suggest that even lower values of the ratio and crude oil are just around the corner.
Secondly, the RSI climbed above the level of 70 for the first time since 2008. Back then, such high reading of this indicator preceded the biggest and the sharpest decline over the last decade. Therefore, in our opinion, if the indicator generates the sell signal, the probability that the history will repeat itself will increase significantly. At this point, it is worth noting that even if we don’t see such dramatical sale in the coming months, all short positions in crude oil should give oil bears significant profits.
Thirdly, the Stochastic Oscillator generated the sell signal, suggesting further deterioration (at least) later this month.
Fourthly, the short-term picture of the ratio and its implications.
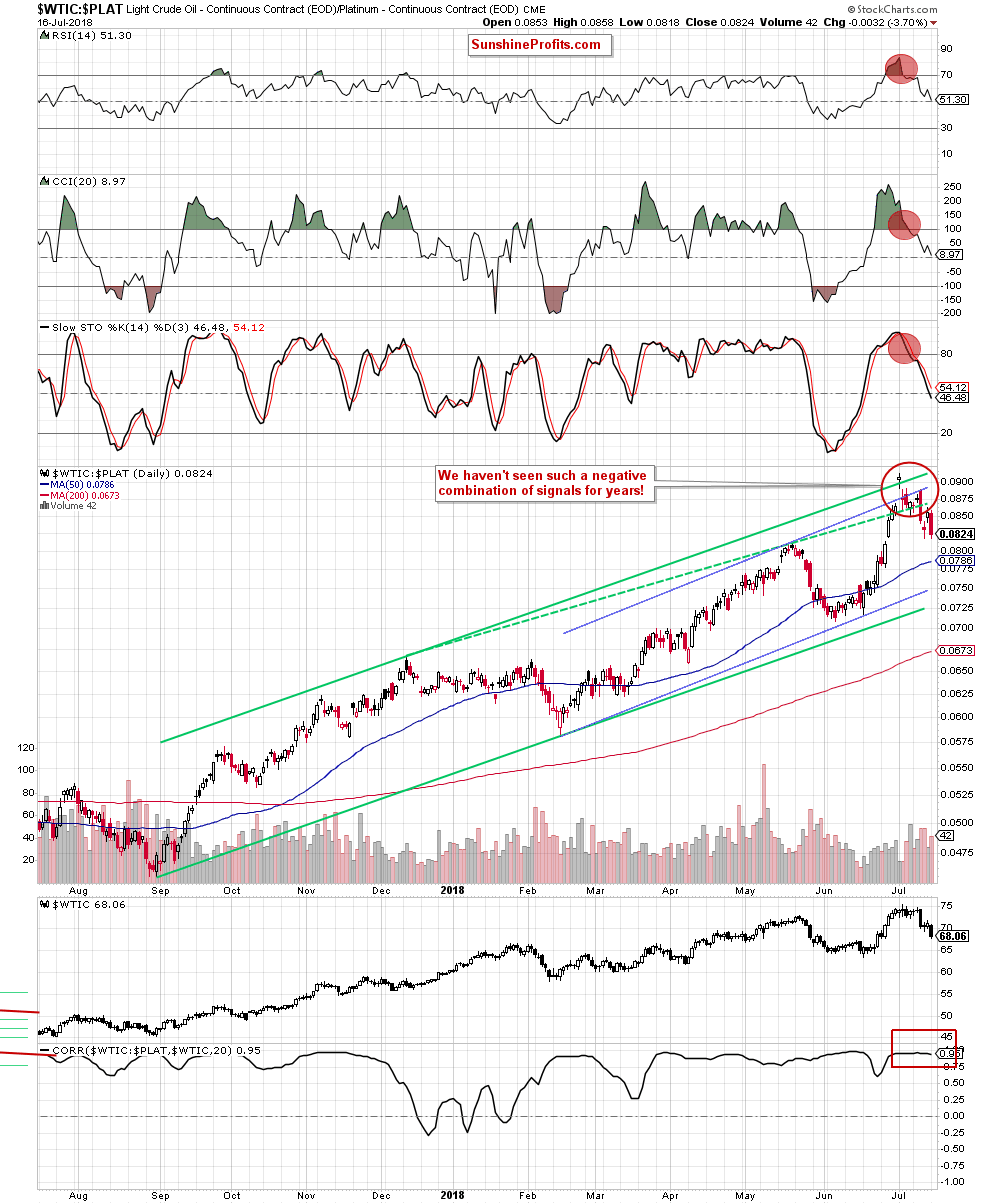
(…) the first thing that catches the eye is the red ellipse around the upper border of the rising trend channels.
What does it say about the current situation? (...) it is very bad for oil bulls. Why? Here are the reasons.
The ratio invalidated the earlier one-day breakout above the long-term upper border of the green rising trend channel at the beginning of the month. Thanks to that price action, it also closed the gap between the last session of June and the first session of July, creating an island reversal formation.
In the above case, we can observe a bearish island reversal (above the upper border of the green rising trend channel), which started with a gap up (an exhaustion gap) followed by a series of white candlesticks. Next day, the ratio formed a gap down (a breakaway gap), which is usually expected to be followed by a bearish trend.
(…) yesterday’s sharp move to the downside can be the answer to this expectation. And if this is the case, the ratio could even test the lower line of the green rising trend channel in the coming weeks.
Additionally, thanks to this month’s price action, the ratio also invalidated the earlier breakout above the upper border of the blue rising trend channel, increasing the probability of a bigger correction – especially when we factor in the fact that we saw a verification of the earlier drop under this line at the beginning of yesterday’s session (the consequences of this event speak for themselves).
On top of that, yesterday’s sharp decline invalidated also the breakout above the green dashed support line based on the previous peaks, giving the sellers extra points in the fight for lower levels.
As if all this was still not enough, all daily indicators generated the sell signals, supporting bears unanimously.
Connecting the dots, the picture that emerges from the oil-to-platinum ratio is very bearish, which significantly increases the probability of a sizable move to the downside in the coming days or maybe even weeks. Most importantly not only for the ratio, but also for black gold as very strong positive correlation between them remains in the cards (in the short term it is even a bit stronger (0.97)).
Finishing this part of today’s alert, it’s also worth noting that Friday’s upswing in the oil-to-platinum ratio looked like an attempt to verify the earlier breakdown under the upper border of the green dashed line.
Unfortunately (for fans of oil price rises), oil bulls didn’t even reach this first resistance, which only revealed their weakness, encouraging rivals to fight for lower levels during yesterday’s session.
Will we see lower values of the ratio in the coming days?
Thanks to Monday’s sharp downswings and the sell signals generated by the RSI, the CCI and the Stochastic Oscillator, the bear's position strengthened, suggesting further declines.
Summing up, our profitable short positions continue to be justified from the risk/reward perspective as crude oil moved sharply lower once again. Additionally, all sell signals generated by the indicators, all negative factors about which we wrote in our previous alerts and a very pro-bearish picture that emerges from the oil-to-platinum ratio suggests that further deterioration and lower prices of crude oil are more likely than not in the coming week.
If you enjoyed the above analysis and would like to receive daily premium follow-ups, we encourage you to sign up for our Oil Trading Alerts. Sign me up.
Thank you.
Nadia Simmons
Forex & Oil Trading Strategist
Przemyslaw Radomski, CFA
Founder, Editor-in-chief, Gold & Silver Fund Manager
Gold & Silver Trading Alerts
Forex Trading Alerts
Oil Investment Updates
Oil Trading Alerts
DISCLOSURE: The views and opinions expressed in this article are those of the authors, and do not represent the views of equities.com. Readers should not consider statements made by the author as formal recommendations and should consult their financial advisor before making any investment decisions. To read our full disclosure, please go to: http://www.equities.com/disclaimer


