Whitecap Resources Inc. announces second quarter 2015 results and increased production guidance
Whitecap Resources Inc. (“Whitecap” or the “Company”) (WCP.TO) is pleased to report its operating and unaudited financial results for the three and six months ended June 30, 2015.
Whitecap’s unaudited interim consolidated financial statements and related Management’s Discussion and Analysis (“MD&A”) are available at www.sedar.com and on our website atwww.wcap.ca.
FINANCIAL AND OPERATING HIGHLIGHTS
|
Three months ended June 30 |
Six months ended June 30 |
||||
|
Financial ($000s except per share amounts) |
2015 |
2014 |
2015 |
2014 |
|
|
Petroleum and natural gas sales |
186,178 |
215,850 |
318,817 |
393,967 |
|
|
Funds from operations (1) |
144,703 |
117,429 |
254,636 |
218,336 |
|
|
Basic ($/share) |
0.51 |
0.51 |
0.90 |
1.02 |
|
|
Diluted ($/share) |
0.50 |
0.51 |
0.89 |
1.01 |
|
|
Net income (loss) |
(8,583) |
195,045 |
(37,986) |
199,585 |
|
|
Basic ($/share) |
(0.03) |
0.85 |
(0.13) |
0.93 |
|
|
Diluted ($/share) |
(0.03) |
0.84 |
(0.13) |
0.92 |
|
|
Dividends paid or declared |
53,181 |
41,993 |
100,722 |
76,003 |
|
|
Per share |
0.19 |
0.18 |
0.38 |
0.35 |
|
|
Total payout ratio (%) (1) |
68 |
80 |
87 |
118 |
|
|
Development capital expenditures |
45,868 |
51,764 |
121,883 |
182,345 |
|
|
Property acquisitions |
13,077 |
791,087 |
71,407 |
800,396 |
|
|
Property dispositions |
(10,805) |
(113,031) |
(13,468) |
(118,232) |
|
|
Corporate acquisitions |
579,906 |
– |
579,906 |
397,482 |
|
|
Net debt outstanding (1) |
774,825 |
752,882 |
774,825 |
752,882 |
|
|
Operating |
|||||
|
Average daily production |
|||||
|
Crude oil (bbls/d) |
28,416 |
19,516 |
27,027 |
18,092 |
|
|
NGLs (bbls/d) |
2,865 |
2,328 |
2,777 |
2,266 |
|
|
Natural gas (Mcf/d) |
61,441 |
52,384 |
60,843 |
49,166 |
|
|
Total (boe/d) |
41,521 |
30,574 |
39,945 |
28,552 |
|
|
Average realized price (2) |
|||||
|
Crude oil ($/bbl) |
64.67 |
102.19 |
57.16 |
98.92 |
|
|
NGLs ($/bbl) |
16.79 |
47.90 |
17.37 |
54.32 |
|
|
Natural gas ($/Mcf) |
2.61 |
5.08 |
2.77 |
5.37 |
|
|
Total ($/boe) |
49.27 |
77.58 |
44.10 |
76.23 |
|
|
Netback ($/boe) |
|||||
|
Petroleum and natural gas sales |
49.27 |
77.58 |
44.10 |
76.23 |
|
|
Realized hedging gain (loss) |
10.76 |
(8.34) |
12.59 |
(8.26) |
|
|
Royalties |
(6.44) |
(10.18) |
(5.82) |
(10.01) |
|
|
Operating expenses |
(9.67) |
(11.35) |
(10.11) |
(10.54) |
|
|
Transportation expenses |
(1.72) |
(1.62) |
(1.61) |
(1.46) |
|
|
Operating netbacks (1) |
42.20 |
46.09 |
39.15 |
45.96 |
|
|
General & administrative |
(1.49) |
(1.50) |
(1.49) |
(1.50) |
|
|
Interest & financing |
(2.41) |
(2.39) |
(2.43) |
(2.21) |
|
|
Cash netbacks (1) |
38.30 |
42.20 |
35.23 |
42.25 |
|
|
Share information (000s) |
|||||
|
Common shares outstanding, end of period |
298,599 |
245,316 |
298,599 |
245,316 |
|
|
Weighted average basic shares outstanding |
283,198 |
229,680 |
283,609 |
213,964 |
|
|
Weighted average diluted shares outstanding |
287,270 |
232,180 |
287,607 |
216,211 |
|
|
Notes: |
|
|
(1) |
Funds from operations, total payout ratio, net debt, operating netbacks and cash netbacks do not have a standardized meaning under GAAP. Refer to non-GAAP measures in this press release. |
|
(2) |
Prior to the impact of hedging activities. |
MESSAGE TO OUR SHAREHOLDERS
Whitecap is pleased to report strong operational and financial results for the second quarter of 2015. We achieved continued growth and record production of 41,521 boe/d (75% oil and NGLs) which was 1,700 boe/d (4%) higher than our forecast of 39,800 boe/d. The higher than anticipated production is mainly due to our Viking production in Lucky Hills, Whiteside and Dodsland trending above our type curves and impacting the quarter by 400 boe/d, acceleration of well completions in our west Pembina program with initial production results 15% higher than forecast (600 boe/d), earlier than expected results from waterflood optimization in our operated west Pembina Cardium Unit (100 boe/d) and our team’s proactive approach to mitigating and optimizing third party downtime including the TCPL restrictions (600 boe/d).
Our cash netbacks remain robust at $38.30/boe generating $144.7 million ($0.50/share) of funds from operations in the quarter including a realized hedging gain of $40.7 million. Our cash costs in the second quarter have decreased 20% compared to the prior year including a 15% decrease in operating costs to $9.67/boe.
We spent $45.9 million of capital in the second quarter which includes the completion of all major facilities at Elnora, completion and tie-in of nine Viking wells in Kerrobert previously drilled by Beaumont Energy Inc. and the drilling of 5 (4.9 net) horizontal Cardium oil wells in west Pembina.
At Elnora, all major processing facilities have been constructed and are fully operational with a capacity of 6,600 boe/d. Operating costs have continued to trend down with the completion of the facilites and are currently less than $4.00/boe. Water injection associated with the waterflood scheme has been underway since May 2015 and initial indications are that the reservoir is performing as expected with reservoir pressure being maintained at optimal levels. For the balance of the year we anticipate producing the reservoir between 4,500 to 5,500 boe/d and our average production target is 5,100 boe/d in 2016 with only $6 million of capital expenditures expected.
In west Pembina we continue to realize cost savings from well construction optimizations and service cost reductions. On our most recent three wells we were able to achieve 16% lower drilling costs and 7% lower completion costs for a total savings of $380,000 per well on standard length horizontals and $450,000 per well on our extended reach horizontal wells.
We continue to maintain a conservative total payout ratio (after dividend payments and capital expenditures) of 68% for Q2/2015 and 87% for 1H/2015 and anticipate our full year 2015 total payout ratio to be 94%.
We highlight the following accomplishments in the second quarter of 2015:
- Production increased 36% (10%/share) to a record 41,521 boe/d (75% oil and NGLs) compared to 30,574 boe/d (71% oil and NGLs) in Q2/2014.
- Funds from operations increased 23% to $144.7 million ($0.50/share) compared to $117.4 million ($0.51/share) in Q2/2014. On a per share basis funds from operations decreased 2% compared to a 36% decrease in realized commodity prices.
- Realized $40.7 million ($10.76/boe) in hedging gains contributing to a solid Q2/2015 cash netback of $38.30/boe that was 20% higher than achieved in Q1/2015.
- Successfully closed and integrated the Viking light oil assets, which were acquired from Beaumont Energy Inc. on May 1, 2015.
- Maintained a strong balance sheet with total borrowing capacity at $1.2 billion of which 35% was un-utilized at quarter end. Net debt to annualized Q2/2015 funds from operations ratio of 1.3 times provides Whitecap with significant financial flexibility for the remainder of the year.
- Maintained a robust hedging program with the following current commodity hedges in place:
- 42% of 2H/2015 forecasted oil production (net of royalties) hedged at an average floor price of C$97.13/bbl and 27% hedged in 2016 at an average floor price of C$98.18/bbl.
- 58% of 2H/2015 natural gas production (net of royalties) hedged at an average floor price of C$3.46/mcf, and 13% hedged in 2016 at an average floor price of C$3.79/mcf.
INCREASED PRODUCTION GUIDANCE
Our Whitecap team continues to deliver exceptional results with our disciplined approach to capital spending and, as a result of our strong 1H/2015 outperformance, we are increasing our full year production guidance by 400 boe/d to 40,100 boe/d from the previous 39,700 boe/d with no increase to our full year capital budget of $235 million.
We remain conservative in our production guidance for 2H/2015 as we anticipate third party downtime including TCPL restrictions affecting our associated natural gas production to continue to be abnormally high and have forecasted this to negatively impact our Q3/2015 production by 500 boe/d. In addition, we have delayed the start-up of some of our Q3/2015 drilling program in an effort to maintain drilling program continuity and enhance our capital efficiency through cost reductions resulting in a 300 boe/d negative impact to our Q3/2015 production.
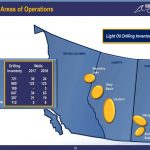
We anticipate spending $115 million in 2H/2015 which includes the drilling of 72 (58.7 net) Viking horizontal oil wells of which 42 (42.0 net) will be in the Kerrobert area of Saskatchewan, 6 (2.7 net) non operated Cardium horizontal oil wells, 4 (3.5 net) horizontal Dunvegan oil wells and 3 (1.5 net) Boundary Lake horizontal oil wells. Approximately 50% of our Kerrobert Viking program will be within the portion of the pool that is under active waterflood. Early indications from our Q3/2015 Kerrobert Viking program are that drilling and completion costs are trending lower than our initial expectations by $50,000 per well to under $700,000 per well.
Whitecap continues to be well positioned to withstand the current low commodity price environment with our strong balance sheet, robust hedge book, high quality oil asset base and our employee commitment to operational excellence. Our focus is on long term sustainability and we anticipate even if crude oil were to average US$45.00/bbl WTI for 2H/2015 our 2015 total payout ratio (after dividend payments and capital expenditures) would be less than 100%. Looking forward to 2016 at US$50.00/bbl – $60.00/bbl WTI we anticipate growing 1-3% on a per share basis and maintaining our current monthly dividend of $0.0625/share all within a fully funded cash flow model.
On behalf of our Management team and Board of Directors, we would like to thank our shareholders for their continuing support.
Note Regarding Forward-Looking Statements and Other Advisories
This press release contains forward-looking statements and forward-looking information (collectively “forward-looking information”) within the meaning of applicable securities laws relating to the Company’s plans and other aspects of our anticipated future operations, management focus, objectives, strategies, financial, operating and production results and business opportunities. Forward-looking information typically uses words such as “anticipate”, “believe”, “expect”, “forecast”, “guidance”, “planned” or similar words suggesting future outcomes, statements that actions, events or conditions “may”, “would”, “could” or “will” be taken or occur in the future. In addition, and without limiting the generality of the foregoing, this press release contains forward-looking information regarding our future production and cash flow, total payout ratio and net debt to funds from operations ratio, our capital program and our capital efficiencies, the benefits to be obtained from our hedging program, the timing, location and extent of future drilling operations; operating cost reductions; processing capacity and third party down time; the results of our operations; performance; business prospects and opportunities; our future dividends and dividend policy, industry conditions and commodity prices.
The forward-looking information is based on certain key expectations and assumptions made by our management, including expectations and assumptions concerning prevailing commodity prices, exchange rates, interest rates, applicable royalty rates and tax laws; future production rates and estimates of operating costs; performance of existing and future wells; reserve and resource volumes; anticipated timing and results of capital expenditures; the success obtained in drilling new wells; the sufficiency of budgeted capital expenditures in carrying out planned activities; the state of the economy and the exploration and production business; the availability and cost of financing, labour and services; the impact of increasing competition; ability to efficiently integrate assets and employees acquired through acquisitions, ability to market oil and natural gas successfully; our ability to access capital; and obtaining the necessary regulatory approvals.
Although we believe that the expectations and assumptions on which such forward-looking information is based are reasonable, undue reliance should not be placed on the forward-looking information because Whitecap can give no assurance that they will prove to be correct. Since forward-looking information addresses future events and conditions, by its very nature they involve inherent risks and uncertainties. Management has included the above summary of assumptions and risks related to forward-looking information provided in this press release in order to provide security holders with a more complete perspective on our future operations and such information may not be appropriate for other purposes.
Readers are cautioned that the foregoing lists of factors are not exhaustive. Additional information on these and other factors that could affect our operations or financial results are included in reports on file with applicable securities regulatory authorities and may be accessed through the SEDAR website (www.sedar.com).
These forward-looking statements are made as of the date of this press release and we disclaim any intent or obligation to update publicly any forward-looking information, whether as a result of new information, future events or results or otherwise, other than as required by applicable securities laws.
Non-GAAP Measures
This press release includes non-GAAP measures as further described herein. These non-GAAP measures do not have a standardized meaning prescribed by International Financial Reporting Standards (“IFRS” or, alternatively, “GAAP”) and therefore may not be comparable with the calculation of similar measures by other companies.
“Funds from operations” or “cash flow” represents cash flow from operating activities adjusted for changes in non-cash working capital, transaction costs and settlement of decommissioning liabilities. Management considers funds from operations and funds from operations per share to be key measures as they demonstrate Whitecap’s ability to generate the cash necessary to pay dividends, repay debt, fund settlement of decommissioning liabilities and make capital investments. Management believes that by excluding the temporary impact of changes in non-cash operating working capital, funds from operations provides a useful measure of Whitecap’s ability to generate cash that is not subject to short-term movements in non-cash operating working capital.
The following table reconciles cash flow from operating activities (a GAAP measure) to funds from operations (a non-GAAP measure):
|
Three months ended |
Six months ended |
|||
|
June 30, |
June 30, |
|||
|
($000s) |
2015 |
2014 |
2015 |
2014 |
|
Cash flow from operating activities |
137,366 |
143,682 |
264,396 |
229,472 |
|
Changes in non-cash working capital |
6,998 |
(27,595) |
(10,449) |
(12,826) |
|
Settlement of decommissioning liabilities |
38 |
273 |
385 |
426 |
|
Transaction costs |
301 |
1,069 |
304 |
1,264 |
|
Funds from operations |
144,703 |
117,429 |
254,636 |
218,336 |
|
Cash dividends declared |
53,181 |
41,993 |
100,722 |
76,003 |
|
Development capital expenditures |
45,868 |
51,764 |
121,883 |
182,345 |
|
Basic payout ratio (%) |
37 |
36 |
40 |
35 |
|
Total payout ratio (%) |
68 |
80 |
87 |
118 |
“Operating netbacks” are determined by deducting royalties, production expenses and transportation and selling expenses from oil and gas revenue. Operating netbacks are per boe measures used in operational and capital allocation decisions.
“Cash netbacks” are determined by deducting cash general and administrative and interest expense from operating netbacks.
“Cash dividends per share” represents cash dividends declared per share by Whitecap.
“Basic payout ratio” is calculated as cash dividends declared divided by funds from operations.
“Total payout ratio” is calculated as development capital plus cash dividends declared divided by funds from operations.
“Net debt” is calculated as bank debt plus working capital deficiency adjusted for risk management contracts. Net debt is used by management to analyze the financial position and leverage of Whitecap.
The following table reconciles bank debt (a GAAP measure) to net debt (a non-GAAP measure):
|
($000s) |
June 30, 2015 |
December 31, 2014 |
|
Bank debt |
733,058 |
756,564 |
|
Current liabilities |
153,342 |
145,998 |
|
Current assets |
(176,558) |
(243,637) |
|
Risk management contracts |
64,983 |
139,365 |
|
Net debt |
774,825 |
798,290 |
“Boe” means barrel of oil equivalent on the basis of 6 Mcf of natural gas to 1 bbl of oil. Boes may be misleading, particularly if used in isolation. A boe conversion ratio of 6 Mcf: 1 bbl is based on an energy equivalency conversion method primarily applicable at the burner tip and does not represent a value equivalency at the wellhead. In addition, given that the value ratio based on the current price of crude oil as compared to natural gas is significantly different from the energy equivalency of 6: 1, utilizing a conversion on a 6:1 basis may be misleading as an indication of value.