NATURAL GAS INVENTORY (Week Ended 7/29/16)
Current: 3,288 Bcf
Actual Injection/(Withdrawal), per EIA: (6) Bcf
Economist Average Estimate, per Bloomberg: 0 Bcf
Previous: 3,294 Bcf
Natural gas inventory is cyclical in nature, to the point where the two cycles are broken into “withdrawal season” and “injection season.” Both are common benchmarks among followers of the natural gas sector.
The “S-curve” that emanates from this cyclical nature helps describe natural gas inventory in a very consistent manner. However, that cycle doesn’t always hold true, as we learned today. In the middle of natural gas injection season, the EIA reported a withdrawal of 6 Bcf from storage. This represents the first withdrawal during the injection season since 2006. This week’s withdrawal compares to the 38 Bcf injection from the comparable week last year and the 5-year average of a 52 Bcf injection. The question remains, how big of a deal is this and what does it mean for natural gas going forward?
The U.S. is experiencing one of the hottest summers on record across the board, and that means that air conditioning units are running at an increased rate this year. Heating and cooling make up a large percentage of natural gas usage, and the increased use of air conditioning may very well be influencing the natural gas market. Last week’s weather was 11% and 27% warmer than the comparable week last year and the 5-year average, respectively. Since May, weather has been 7% and 8% warmer than last year and the 5-year average, respectively. And the surprises may not be over yet, with approximately 49% of cooling degree days (CDDs) still in front of us for the remainder of the summer.
EnerCom Analytics has been looking at natural gas production and storage as it relates to rig efficiencies. During this year’s “injection season,” there has been an average of 87 gas rigs working. Last year during the same period, there were 220 rigs operating in the U.S. Based on the slope of the build vs. last year, holding all else equal, operators are ~50% more efficient with the rigs that are working. This is a result of several potential catalysts.
Ever since the decline in commodity prices, companies have high-graded assets and current drilling activity is focused on the best rock and best acreage positions for each company, with the best crews employed as the operators of the drilling rigs and well completion equipment.
In recent years, companies seem to have surmounted the learning curve and are now advancing drilling and completion practices to push the limits of lateral lengths of wells, increase EURs, and generate higher IP rates. And Mother Nature’s apparent fever has increased temperatures across the country giving support to the demand side of the equation.
The chart below shows a prediction of what may happen based upon the rig count and the efficiency of those rigs, as well as a look at an estimate based upon the 5-year average for natural gas storage.
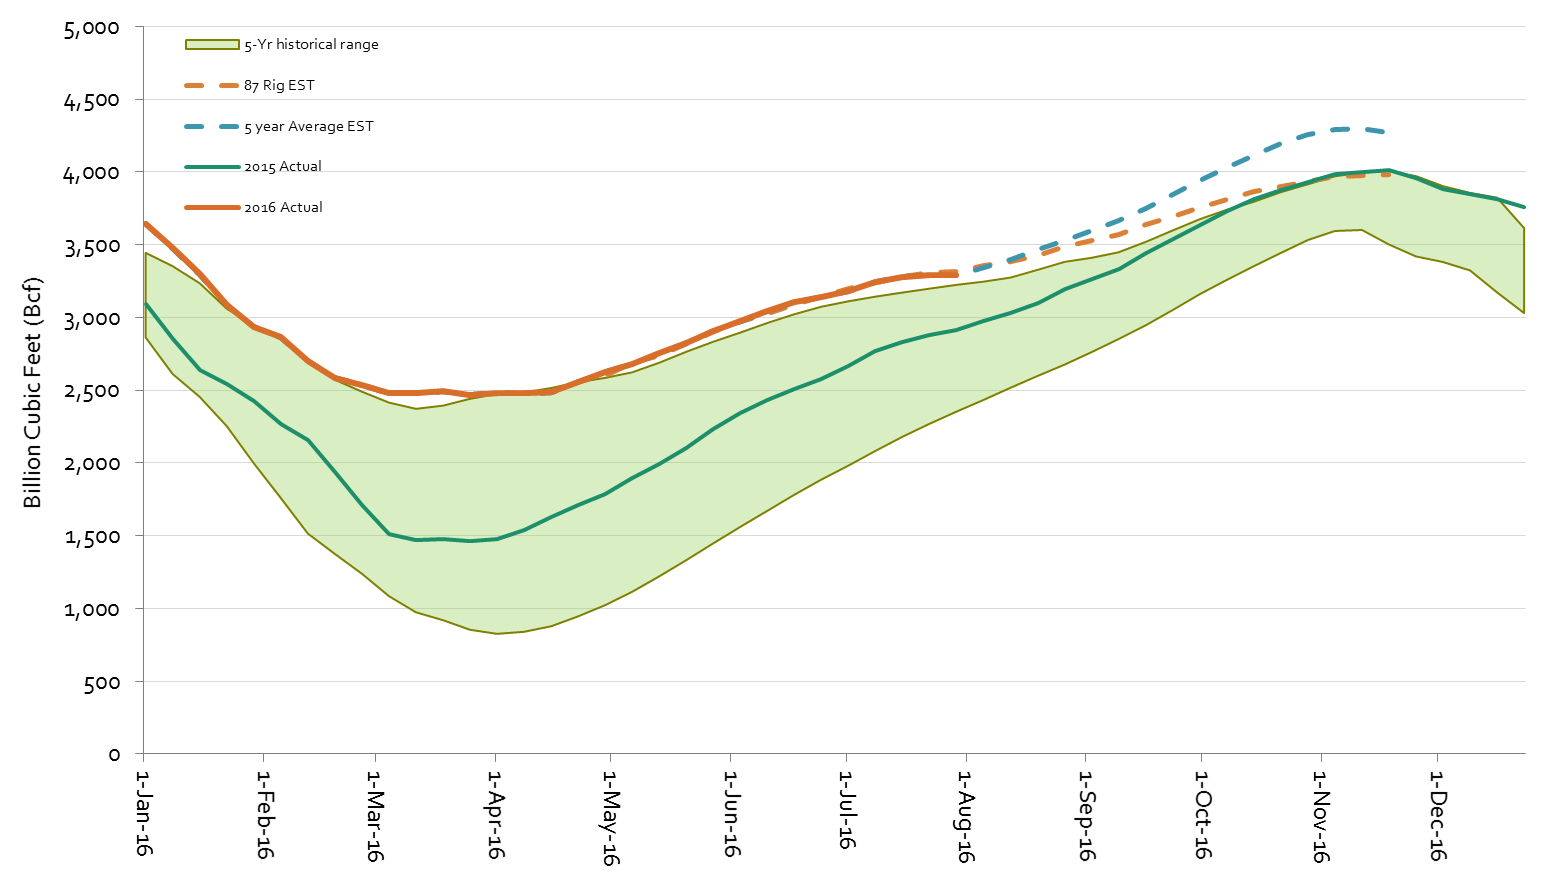
Natural gas inventory has been hovering just above the 5-year maximum for most of 2016, in what most analysts term as a surplus. Even with the rig efficiencies exhibited by the dotted orange line, the storage may come right back in line with 2015 actuals and the inside the 5-year historical range around the October/November time period. If we get additional support from Mother Nature, we could see it our storage levels return to “normal” levels sooner.