What a difference a year makes.
When Oil & Gas 360® released its year in review piece exactly 365 days ago, the Energy Information Administration (EIA) was projecting oil volumes to rise through 2016 and natural gas volumes to continue their climb through 2040. What the EIA could not project was a debatable glut in the market, first seen in spot prices for Midland, Texas, in July. A SunTrust Robinson Humphrey note on August 21, issued shortly after EnerCom’s Oil & Gas Conference® 19, explains:
“The recent success of big new oil wells in the Permian and sizable new gas wells in the Utica/Marcellus have led to a mismatch between the amount of oil or gas being produced and the ability to move it… The price of oil was $73.48 per barrel in Midland on Tuesday (8/19) versus the benchmark pricing point for U.S. crude contracts in Cushing OK at $94.48 per barrel. The $21 Permian discount was the widest since at least 1991, when regular tracking of the price differential began.”
A Raymond James note on August 25, added, “The Permian midstream system is stretched, and the stocks are feeling it.”
Such wide ranging differentials are no more. By market close on December 30, the respective prices of Brent, WTI and Midland were $57.90, $54.12 and $48.19. The Williston Basin is even worse. According to the Crude Oil Price Bulletin by Plains Marketing, Williston prices were well below $40, with the sour grade trading at only $25.83. Natural gas is also feeling the heat, as stockpiles have fully recovered from lower than normal inventories that persisted throughout most of 2014. Natural gas closed out 2014 at $2.91 – a 28 month low.
Low Prices Overshadow Another Record-Setting Year
Reduced expenditures and widespread consolidation are on the minds of many North American producers, but the recent fear of the market dampens what has been, on a national level, another successful year in the industry.
The EIA’s Proved Reserves report, issued annually in December, increased the United States’ total oil and condensate reserves to 36.5 billion barrels – a gain of 3.1 billion barrels (or 9.3%) from last year’s estimate and the most overall since 1975. The Bakken/Three Forks regained the top spot among tight oil plays, and North Dakota’s reserves accounted for 1.9 billion barrels (60%) of the jump. Texas is the only state with more reserves.
Similarly, natural gas reserves increased to 354 Tcf, a gain of 31.3 Tcf (9.7%), setting a new record and more than offsetting all production in 2013. Pennsylvania and West Virginia accounted for 21.9 Tcf (70%) of the increase.
Production volume is matching the reserve gains. The U.S. increased crude oil production to 12.3 MMBOPD in 2013 – 43% higher than 2008’s mark of 8.6 MMBOPD. Natural gas production increased to 24.3 Tcf in fiscal 2013, 17% higher than 2008 and 25% higher than 2005. Interestingly enough, the number of active drilling rigs in 2013 (1,761) was actually lower than 2008 (1,879) as producers created more efficient drilling methods through pads, laterals and increased recovery. For example, operators in the Utica set several records throughout the year, with Range Resources (RRC) producing a well with a peak 24 hour rate of 59 MMcf/d in Washington County, Pennsylvania, and PDC Energy (ticker: PDCE) drilling a lateral more than 11,000 feet in length.
Energy Independence?
The ever-increasing domestic production is reducing United States reliance on imports. Total imported crude for October 2014 was 276.1 MMBO – 40% below the peak month of 455.6 MMBO in August 2006. The import low for 2014 was in February, when the 256.2 MMBO of imported crude marked the lowest since February of 1996. Overall, 2013 yielded the least amount of overall energy imports in 20 years.
Most importantly, the source of the imports has also shifted. When the U.S. reached its import high in August 2006, the Organization of Petroleum Exporting Countries (OPEC) accounted for 198.1 MMBO (43%) and Canada contributed 76.1 MMBO (17%). In October 2014, OPEC’s share declined to 81.5 MMBO (30%) while Canada’s increased to 107.0 MMBO (39%). In the same time frame, Saudi Arabia’s share has dropped to 25.6 MMBO from 46.9 MMBO. Saudi Arabia has actually maintained its market share of roughly 9% in the span, but domestic production and Canada crude has offset the need for the kingdom’s goods.
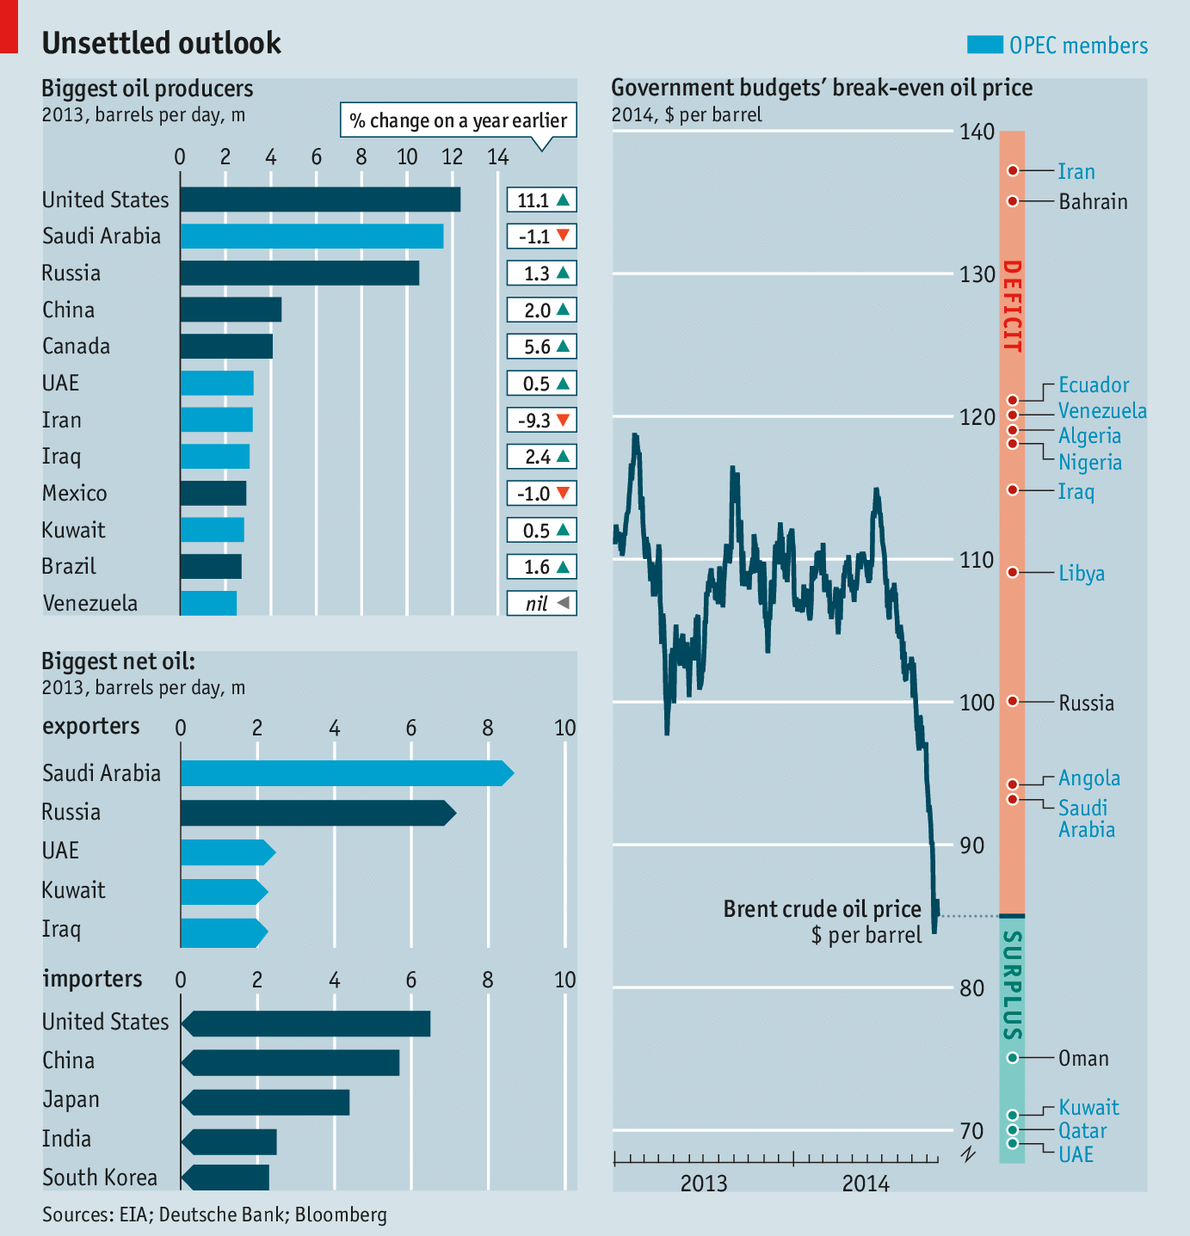
The EIA reports OPEC members (excluding Iran due to its sanctions) will earn about $700 billion in revenue from net oil exports in 2014. The earnings are the lowest since 2010 and represent a 14% decline from 2013. Projections for 2015 are drastic: the EIA expects the group’s smaller market share, combined with the decline in commodity prices, to total only $446 billion in annual revenue. The estimate is 46% below levels from 2014.
If you believed cash-strapped E&Ps are in trouble, the EIA says countries like Venezuela, Iraq and Ecuador were already running fiscal deficits in 2013 and may not be able to fill budget gaps for as long as their other cartel members. Venezuela and Algeria have both asked OPEC to curtail production in order to boost the Brent price.
Energy as a Political Weapon
Sanctioning hydrocarbon sales have proven to be an effective form of action against countries at odds with the United States. The effects are apparent in Iran, where its unemployment rate has climbed above 14%, according to Statistica. Russia is the latest to feel the pressure; the ruble has fallen 45% against the dollar in 2014. Iran and Russia rely on hydrocarbon production for approximately 23.0% and 18.7% of their respective GDP.
As we all know, Saudi Arabia’s preference of production over price has greatly impacted the booming oil market and prompted agencies like the EIA and International Energy Agency to cut price forecasts by more than $25. Speculation is wide ranging, with some believing the Saudis are testing U.S. shale while others believe the kingdom is stepping on the throat of both Russia and Iran, its sanctioned production rivals. All oil producers involved must march forward and tolerate the low prices, for the time being.
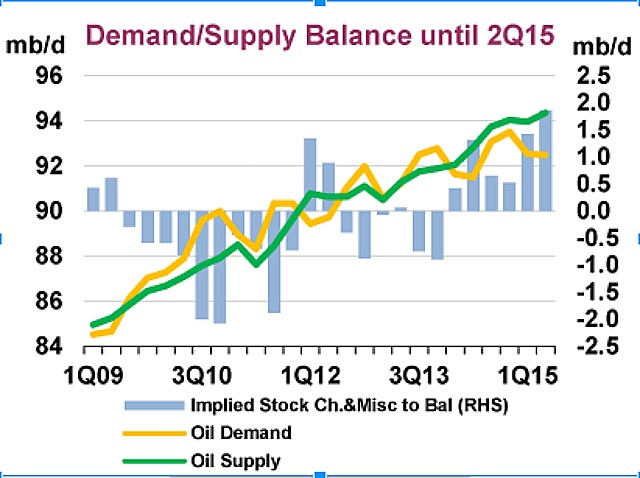
Even in a bearish market, the EIA expects U.S. volumes to increase in 2015. Total liquids production is forecasted to jump to 12.5 MMBOPD, up from 11.6 MMBOPD in 2014. If achieved, it will be the highest level since 1972, said Adam Sieminski, the EIA’s Administrator. The EIA projections were revised downward from previous estimates to reflect the drilling slowdown, but it’s safe to say 2015 looks like another year of production increases.
What Lies Ahead for E&Ps
The majority of E&Ps are trimming expenditures and focusing on core assets in the near term, while delaying plans for exploration and wildcat projects. Comstock Resources (ticker: CRK) is postponing its oil drilling and focusing purely on gas in 2015. Click here for a list of companies and their respective guidance for the upcoming year.
In an interview with Bloomberg, Tom Petrie, Chairman of Petrie Partners, mentioned how many producers are still able to grow production despite their reduced expenditures. “The cost component may limit your income but it doesn’t cause you to shut in production,” he said. “That’s why you see some companies talking about cutting budgets by up to 30%, but we’re still going to grow absolutely in terms of barrels due to the lag of bringing on production from last year.”
Market fears on the oil price decline has aggravated energy stocks, and highly levered companies suddenly find themselves in a much more difficult situation. In EnerCom’s E&P Weekly, the stock price of its 87 listed companies has declined by a median of 36% this year. The median debt to market cap ratio is 76% – more than double the ratio of 35% for the week ended August 1. Notable developments of the drop are seen in the recent acquisition of Talisman Energy (ticker: TLM) for $13 billion (down from the previous offer of $17 billion in August), and a recent Reuters article about the first LNG project falling as a “casualty” to low oil prices.
Petrie expressed confidence in his interview, saying: “This isn’t like the mid-80s, where half of the consolidations that occurred were mergers and the other half were bankruptcies. This time around, I see the amount of forced reorganization being around 10% to 15%.”
Companies who have carefully protected their balance sheets may have a prime opportunity to snap up some of the more highly levered companies. Large cap E&Ps like Cabot Oil & Gas (ticker: COG), Cimarex Energy (ticker: XEC), EOG Resources (ticker: EOG), Occidental Petroleum (ticker: OXY), Pioneer Natural Resources (ticker: PXD) and Southwestern Energy (ticker: SWN) all have a debt to market cap of less than 20% and are well positioned for acquisitions. Supermajors like ExxonMobil (ticker: XOM), Chevron (ticker: CVX) and Shell (ticker: RDS.B) are obviously in the conversation as well.
“Oil leveraged E&Ps are disadvantaged in the near term, but I believe there’s been enough lessons learned from time’s past about being overlevered and overconcentrated in a particular area,” said Petrie. “Most of the players in this environment should be fine.”
Important disclosures: The information provided herein is believed to be reliable; however, EnerCom, Inc. makes no representation or warranty as to its completeness or accuracy. EnerCom’s conclusions are based upon information gathered from sources deemed to be reliable. This note is not intended as an offer or solicitation for the purchase or sale of any security or financial instrument of any company mentioned in this note. This note was prepared for general circulation and does not provide investment recommendations specific to individual investors. All readers of the note must make their own investment decisions based upon their specific investment objectives and financial situation utilizing their own financial advisors as they deem necessary. Investors should consider a company’s entire financial and operational structure in making any investment decisions. Past performance of any company discussed in this note should not be taken as an indication or guarantee of future results. EnerCom is a multi-disciplined management consulting services firm that regularly intends to seek business, or currently may be undertaking business, with companies covered on Oil & Gas 360®, and thereby seeks to receive compensation from these companies for its services. In addition, EnerCom, or its principals or employees, may have an economic interest in any of these companies. As a result, readers of EnerCom’s Oil & Gas 360® should be aware that the firm may have a conflict of interest that could affect the objectivity of this note. The company or companies covered in this note did not review the note prior to publication. EnerCom, or its principals or employees, may have an economic interest in any of the companies covered in this report or on Oil & Gas 360®. As a result, readers of EnerCom’s reports or Oil & Gas 360® should be aware that the firm may have a conflict of interest that could affect the objectivity of this report.


