Earnings season is approaching, and balance sheets will carry more weight than they have in years.
The oil price slide has resulted in a much greater debt to market cap percentage across the oil and gas sphere. In EnerCom’s E&P Weekly for the period ended September 26, the median debt/market cap percentage was 40%. In the latest edition for the week ended January 9, the median was 83%. The larger E&Ps, as a whole, maintained a relatively low percentage despite the commodity swing. The differentiation ranges greatly as you move down the list, as evidenced by the chart below.
| EnerCom’s E&P Weekly Report (89 Companies) | ||||
| Capitalization Size | # of Companies | Median Debt/Market Cap | Difference | |
| 9/26/14 | 1/9/15 | |||
| Large | 22 | 23% | 35% | -12 |
| Mid | 22 | 49% | 87% | -38 |
| Small | 23 | 78% | 165% | -77 |
| Micro | 22 | 59% | 199% | -140 |
Many analysts have already identified certain companies (which will go unnamed) as prime consolidation targets. Capital One Securities speculates the midstream sector will be an area of “healthy consolidation” in 2015, according to its note on December 22. The large cap companies with ample cash on hand are in an advantaged position to scoop up some of their smaller competitors who may be financially troubled.
Tom Petrie, Chairman of Petrie Partners, isn’t convinced the current market will result in widespread mergers and acquisitions. He told Bloomberg he expects the amount of forced reorganization to be around 10% to 15% of all M&A. He explained: “This isn’t like the mid-80s, where half of the consolidations that occurred were mergers and the other half were bankruptcies… Oil leveraged E&Ps are disadvantaged in the near term, but I believe there’s been enough lessons learned from time’s past about being overlevered and over-concentrated in a particular area. Most of the players in this environment should be fine.”
Which E&Ps Shine the Brightest?
Our comparison table shows the smaller companies are much more likely to have high debt ratios, but a handful of mid-small-micro cap E&Ps have managed to keep debt levels to a minimum.
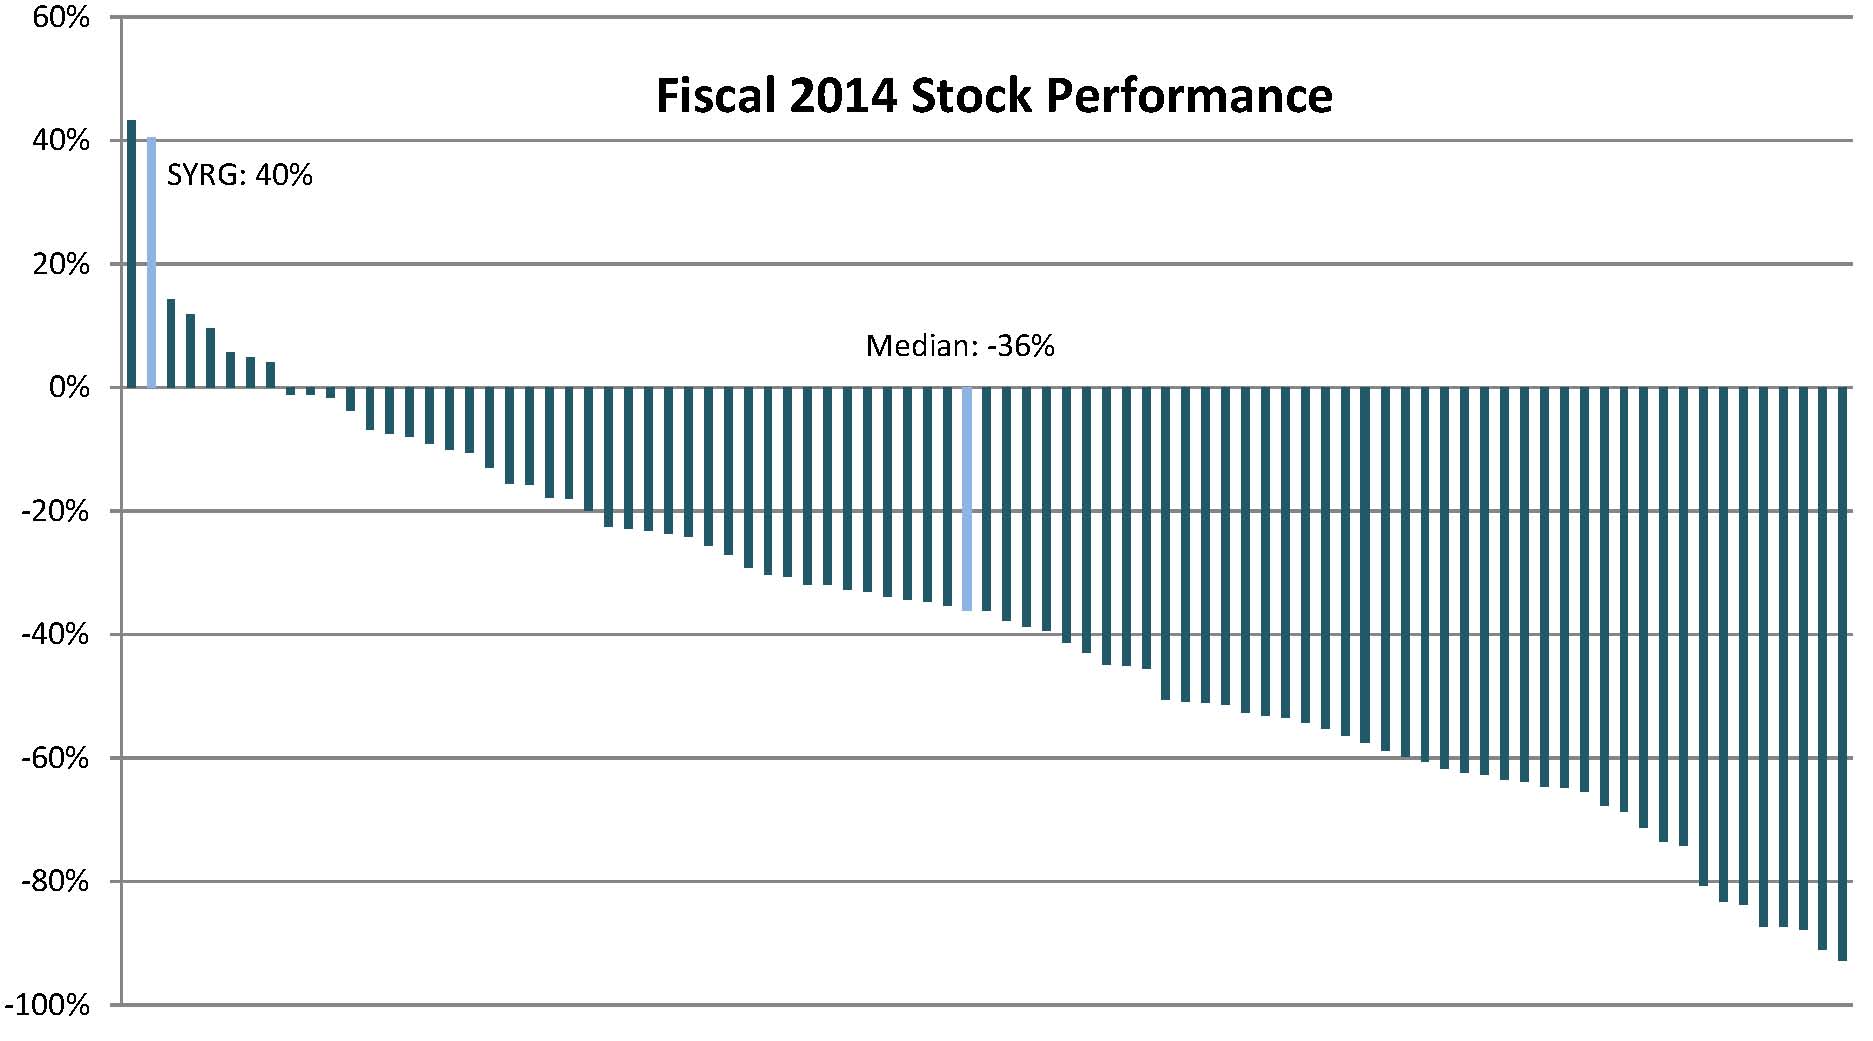 Among them is Synergy Resources (ticker: SYRG), a Colorado-based producer focused on the Niobrara. SYRG announced its year-over-year net income more than tripled in its Q1’15 results, released on January 9. Production is up 158% in the same time frame. Despite the rapid growth, SYRG has maintained low debt. In EnerCom’s latest release, the debt relative to market capitalization is only 3%. The company’s performance in the last E&P Weekly of 2014 is reflective of its growth: Year to date stock performance, solely considering the 2014 fiscal year, increased by 40%. The only company of the 86 peers with a greater growth trajectory was Panhandle Oil & Gas (ticker: PHX), with 43%. Synergy posted the greatest growth rate of its peers in Q4’14.

Evolution Petroleum (ticker: EPM) is another, and has taken a rather non-traditional approach of exploiting the Delhi Field of northeast Louisiana via an artificial lift. Evolution is recognized as a shareholder friendly company and often returns value to its shareholders, even though it has a market cap of roughly $250 million. A total of $3.3 million was returned to unitholders in Q3’14. As an added bonus, the Delhi Field (23.9% working interest) has just reached payout, increasing EPM’s net revenue interest to 26.5% from 7.4%. The difficult stage of the Delhi project appears to be in EPM’s rearview mirror, and gross production is expected to double in the next five to seven years. Keep in mind that Evolution will be receiving more than triple the net income from before, and they’ve managed to reach this level with zero debt on its balance sheet. Insider ownership represents 34% of all common stock – a sign of why the E&P treats its shareholders so favorably.

Callon Petroleum (ticker: CPE) successfully transitioned to a full-scale Permian operator in 2014, exiting the last of its non-core assets in the Gulf of Mexico. Now, Permian production continues to increase and was projected at 7.4 MBOEPD (midpoint) for Q4’14. The forecast would represent increases of 31% and 92%, respectively, compared to Q3’14 and Q4’13. Most companies growing at that rate turn to the debt markets to fuel the rise in production, but CPE currently carries $103 million in debt – or 36% of its market cap. Its price to cash flow per share multiple in EnerCom’s E&P Weekly is 2.4x, but our predicted value calls for an increase to 4.9x – the second-largest value jump, percentage-wise, of any of our 45 covered small to micro cap companies. Callon’s asset position strengthens its outlook, as Capital One Securities explains in a December 22 note: “While no liquids play will be immune from the overall reduction in drilling activity, few are questioning the resiliency of the Permian and Eagle Ford economics relative to several more marginal Mid-Continent plays.”
Important disclosures: The information provided herein is believed to be reliable; however, EnerCom, Inc. makes no representation or warranty as to its completeness or accuracy. EnerCom’s conclusions are based upon information gathered from sources deemed to be reliable. This note is not intended as an offer or solicitation for the purchase or sale of any security or financial instrument of any company mentioned in this note. This note was prepared for general circulation and does not provide investment recommendations specific to individual investors. All readers of the note must make their own investment decisions based upon their specific investment objectives and financial situation utilizing their own financial advisors as they deem necessary. Investors should consider a company’s entire financial and operational structure in making any investment decisions. Past performance of any company discussed in this note should not be taken as an indication or guarantee of future results. EnerCom is a multi-disciplined management consulting services firm that regularly intends to seek business, or currently may be undertaking business, with companies covered on Oil & Gas 360®, and thereby seeks to receive compensation from these companies for its services. In addition, EnerCom, or its principals or employees, may have an economic interest in any of these companies. As a result, readers of EnerCom’s Oil & Gas 360® should be aware that the firm may have a conflict of interest that could affect the objectivity of this note. The company or companies covered in this note did not review the note prior to publication. EnerCom, or its principals or employees, may have an economic interest in any of the companies covered in this report or on Oil & Gas 360®. As a result, readers of EnerCom’s reports or Oil & Gas 360® should be aware that the firm may have a conflict of interest that could affect the objectivity of this report.