EnerCom, Inc. compiled first quarter earnings per share, revenue, EBITDA and cash flow per share analyst consensus estimates on 181 E&P and OilService companies in our database.
Click here for the full chart of estimates.
The median OilServices company earnings estimate for the quarter ending March 31, 2014, is $0.33 per share compared to actual earnings per share of $0.24 and $0.26 for Q4’13 and Q3’13, respectively. In Q1’13, the average OilServices company earnings were $0.33. The median E&P company earnings estimate for the quarter ending March 31, 2014, is $0.24 per share compared to actual earnings per share of $0.04 and $0.11 for Q4’13 and Q3’13, respectively. In Q1’13, the average E&P company earnings were $0.02.
ENERGY COMMODITY PRICES
Near-term futures price for WTI oil averaged $98.61, $97.61 and $105.81 per barrel during Q1’14, Q4’13 and Q3’13 respectively, while the near-term futures price for Henry Hub natural gas averaged $4.72, $3.85, and $3.56 per MMBtu over the same time periods. WTI averaged $94.36 per barrel in Q1’13.
Crude Oil. U.S. oil consumption in December 2013 was 18.9 MMBOPD, down -0.8% compared to the prior month but 1.5% higher than the same month last year. U.S. crude oil production was 7.9 MMBOPD, 13.0% higher than the same month last year. The average near-term futures price for WTI in March 2014 was $100.51 per barrel, flat with the prior month and 8.2% higher than the same month last year. The five-year strip at March 31, 2014 was $85.90 per barrel.
 The average price of gasoline (all grades, all formulations) in March 2014 was $3.61 per gallon, 5.2% higher than the previous month but -4.5% lower than the same month last year. In March 2014, the average near-term futures price for Brent was $107.75 per barrel, down -0.9% from the prior month and 7.2% higher than the WTI near-month futures price.
The median analyst estimate at the beginning of April for 2014 NYMEX oil was $95.00 per barrel with a high of $103.00 per barrel and a low of $90.00 per barrel.
Natural Gas. In January 2014, total natural gas consumption was 96.9 Bcf/d, up 9.9% from the prior month and 12.4% higher than the same month last year. Dry gas production in January 2014 was 67.7 Bcf/d, up 0.25% from December 2013, and up 3.25% over the same month last year.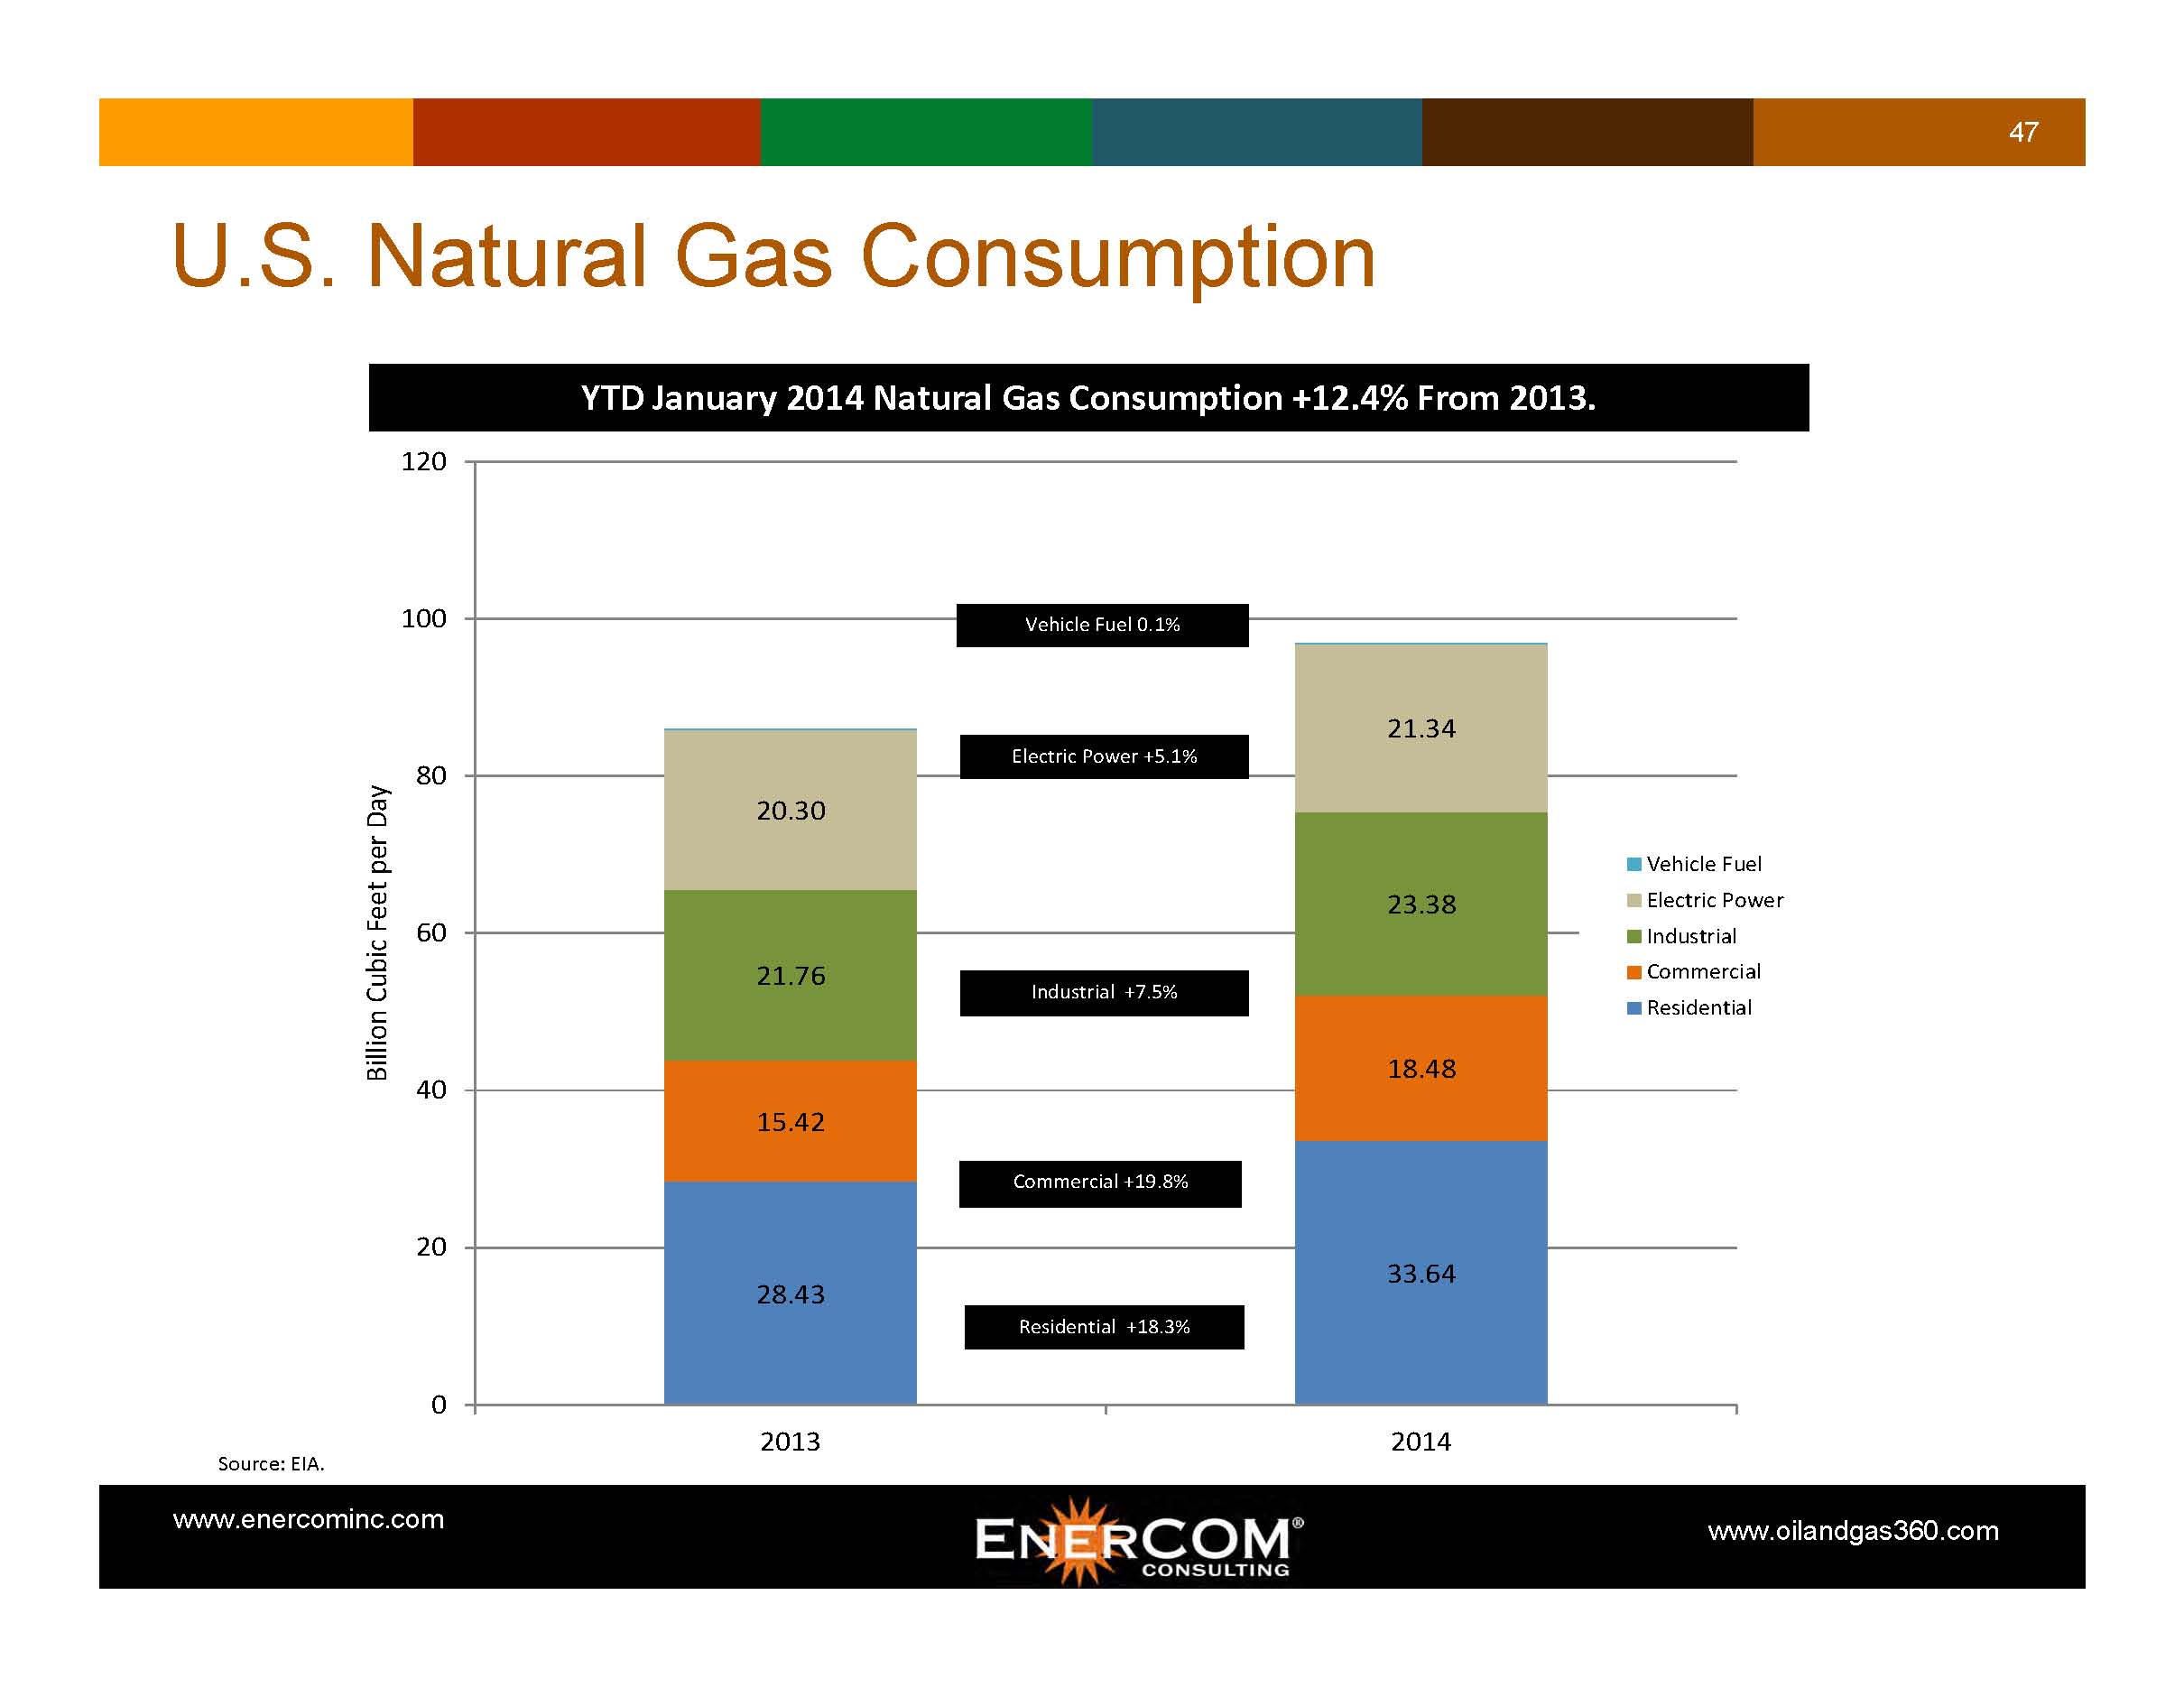 For the month of January 2014 (the most recent data point), the EIA reported that U.S. LNG imported an average of 0.28 Bcf/d.
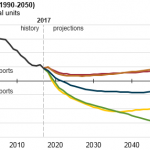
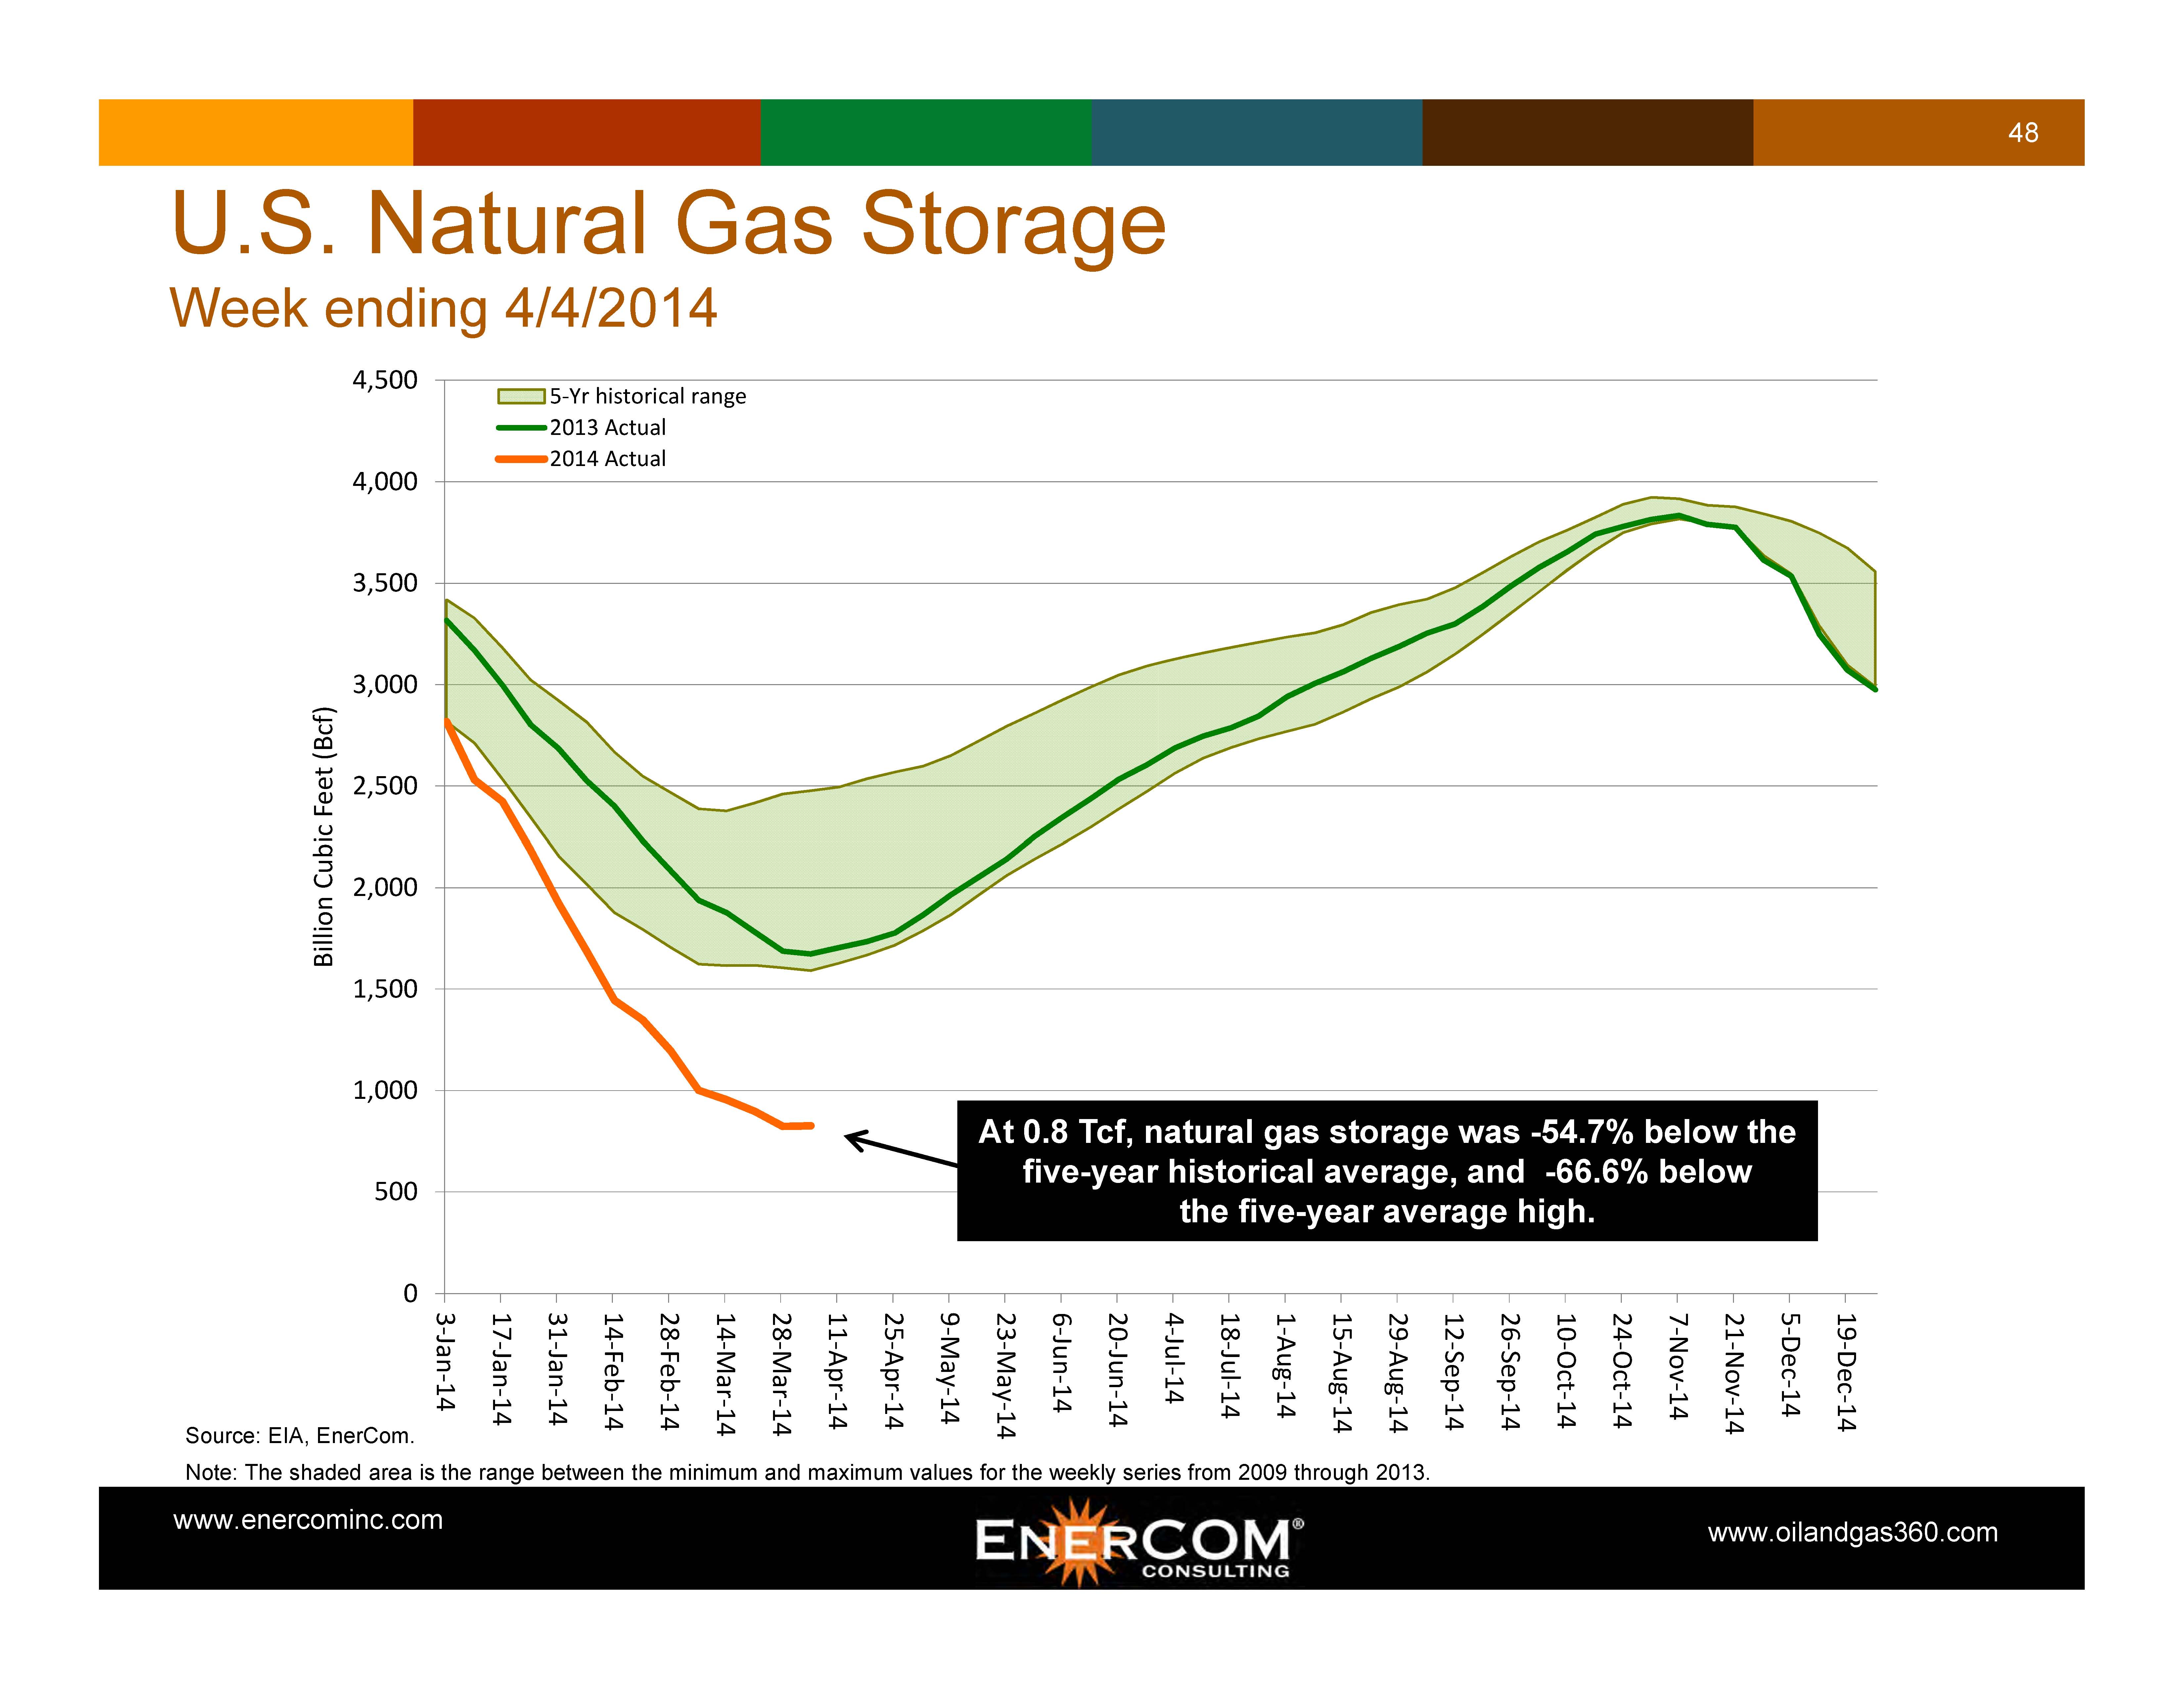
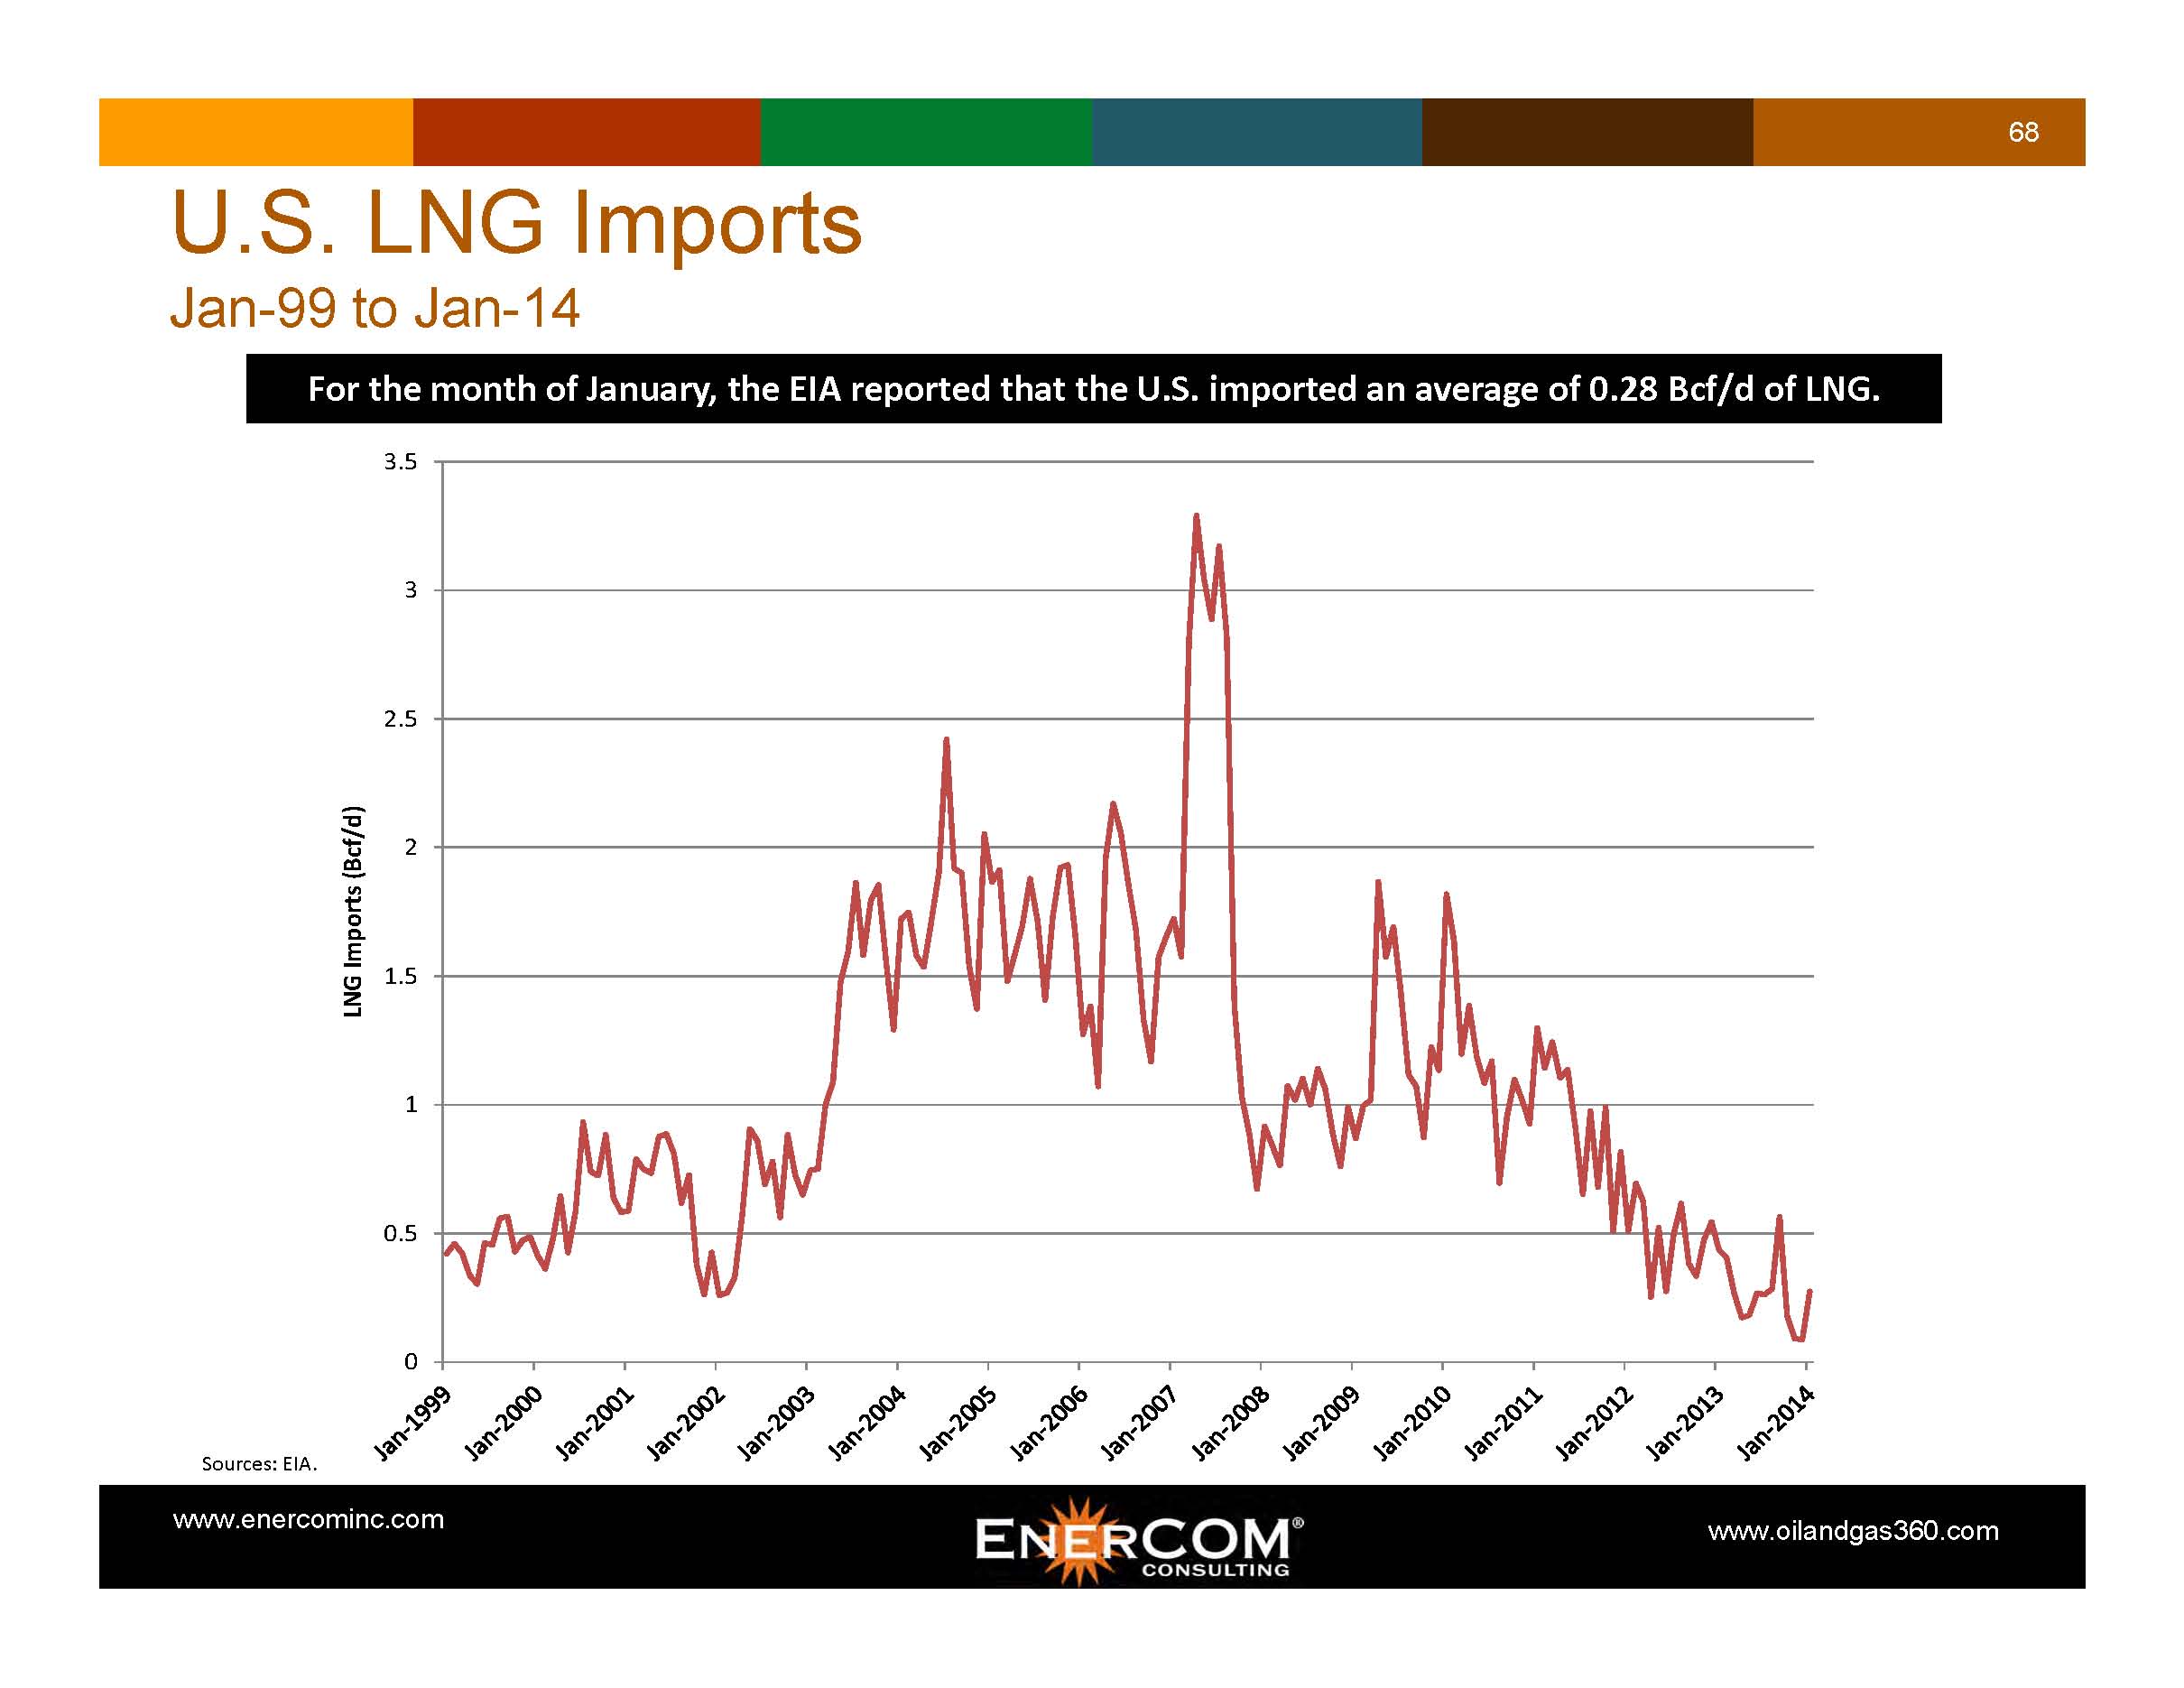 At 0.8 Tcf (week ending 4/4/14), natural gas storage was -54.7% below the five-year historical average, and -66.6% below the five-year high. Current U.S. working natural gas storage capacity stands at 4.8 Tcf. OAG360 notes that to reach the five-year average working gas storage level of 3.85 Tcf when the withdrawal season starts in October, the net injection per week will have to average 110 Bcf, or 184% more than the average weekly five-year injection rate of 38.8 Bcf!
 The average near-term futures price for Henry Hub in March 2014 decreased to $4.48 per MMBtu or -13.2% lower than the prior month, and 18.8% higher than the same month last year. The five-year strip at March 31, 2014 was $4.29 per MMBtu. The median analyst estimate at the beginning of April for 2014 NYMEX gas was $4.00 per MMBtu with a high of $5.00 per MMBtu and a low of $3.70 per MMBtu.
Rig Count. The U.S. land rig count sourced from RigData on March 7, 2014, stood at 1,994 rigs, an increase of 50 rigs from Q1’14. On April 4, 2014, there were 1,299 horizontal rigs in the U.S., an increase from 1,248 in Q1’2014. Since December 11, 2011, the number of horizontal rigs exclusively targeting natural gas has dropped to 203 from 396 – a decline of 49%. In the same period, the number of rigs targeting oil exclusively has increased to 280 rigs from 198 – an increase of 41%.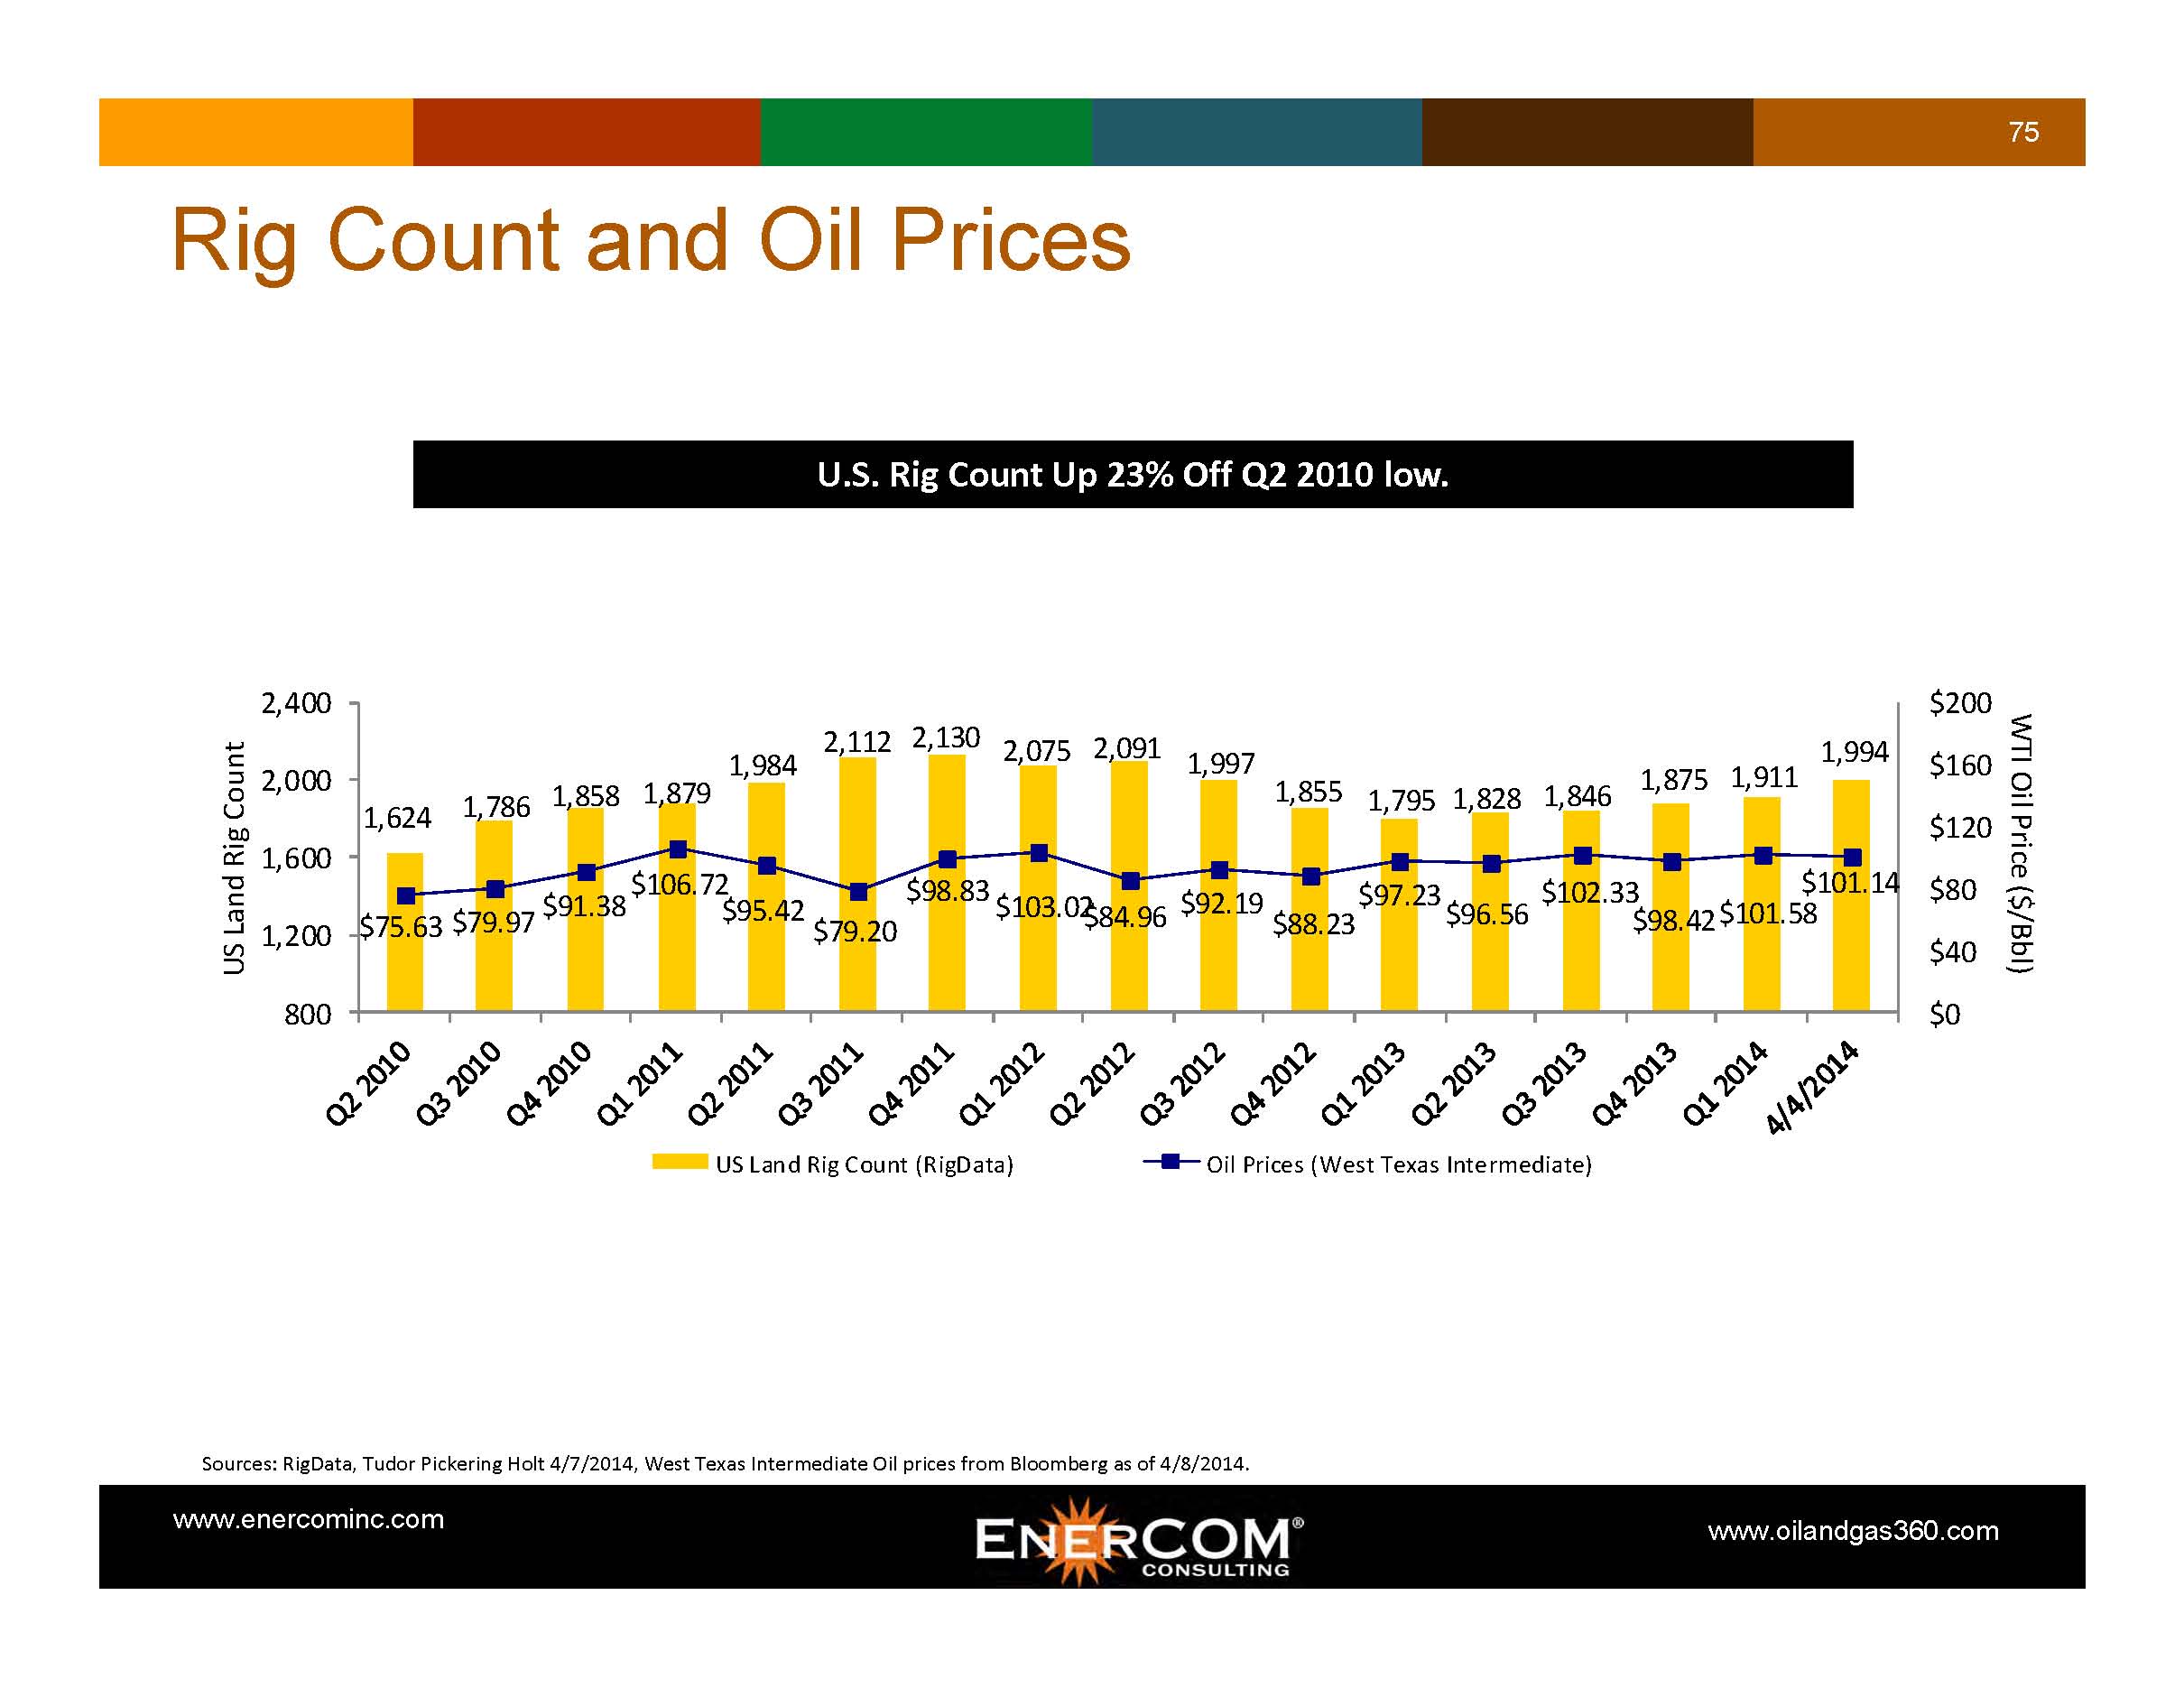 By play and in comparison to Q4’13, rig count changes on March 7, 2014 include the Haynesville (-1 rig), Fayetteville Shale (-1 rig), Woodford Shale (+1 rig), Appalachian Basin (+6 rigs), Williston Basin (+12 rigs), Eagle Ford Shale (+1 rig), DJ Niobrara (+3 rigs) and Permian Basin (+31 rigs).
On April 4, 2014, 65% of working rigs were drilling horizontally, unchanged from Q1’2014.
Equity Markets. In March 2014, the S&P 500, XNG, XOI and OSX changed by 0.7%, 1.9%, 2.3% and 3.2% month-to-month, respectively. The S&P 500 had the largest year-over-year increase gaining 18.4%.
From EnerCom’s E&P Database: For April 4, 2014 year-to-date large-cap, mid-cap, small-cap and micro-cap E&P stocks gained 6.2%, 8.0%, 7.4% and 4.6%, respectively. Year-to-date, oil-weighted and gas-weighted companies gained 11.5% and 5.9%, respectively.
By region as of April 4, 2014 year-to-date, Bakken, Midcontinent and Diversified stocks gained 7.1%, lost -3.5% and gained 18.3%, respectively, Gulf of Mexico stocks were up 13.5%.
From EnerCom’s Oil Service’s Database: As of April 4, 2013 year-to-date, Oil Service’s large-cap, mid-cap, small-cap and stocks gained 4.3%, 1.4%, 6.2% and micro-cap stocks lost -2.8%, respectively.
Expected Themes for Conference Calls
Below are some themes and thoughts we expect to take prominence on this quarter’s conference calls.
E&P Companies:
- New play activity and results (Tuscaloosa Marine Shale, Utica, Mississippian Lime)
- U.S. crude delivery and refining systems (rail systems, etc.)
- Infrastructure build out in Bakken, Eagle Ford, and D-J Basins
- Crude oil and natural gas differentials (Wattenberg, Bakken, etc.)
- Oilfield service costs and outlook
- Drilling and completion efficiencies (Batch completions and pad drilling)
- Down spacing opportunities in the Permian, Eagle Ford and Marcellus
- Addressing low natural gas inventories and implications on price
- Capital allocation within 2014 budgets
- 2014 commodity price outlook
- Oil versus gas exploitation
- Midstream contracts and take-away capacity
- Micro Seismic/4D Shoots
- Lack of M&A activity in the E&P space
OilService Companies:
- Government permitting for LNG ports
- Global economic outlook
- Natural gas prices influencing activity levels
- Adverse winter weather and effects on pressure pumping and fracing jobs
- International margins vs. North American margins
- Rig Count – Effects of drilling efficiencies
- Trends and outlook on dayrates and backlog (onshore and offshore drillers)
- Balance sheet strength and liquidity
- Deepwater activity
- Oilfield service equipment utilization rates
- Work activity in Permian, Appalachia, Rockies
- New equipment buys and builds
- Potential LNG shipments
[sam_ad id=”32″ codes=”true”]
Important disclosures: The information provided herein is believed to be reliable; however, EnerCom, Inc. makes no representation or warranty as to its completeness or accuracy. EnerCom’s conclusions are based upon information gathered from sources deemed to be reliable. This note is not intended as an offer or solicitation for the purchase or sale of any security or financial instrument of any company mentioned in this note. This note was prepared for general circulation and does not provide investment recommendations specific to individual investors. All readers of the note must make their own investment decisions based upon their specific investment objectives and financial situation utilizing their own financial advisors as they deem necessary. Investors should consider a company’s entire financial and operational structure in making any investment decisions. Past performance of any company discussed in this note should not be taken as an indication or guarantee of future results. EnerCom is a multi-disciplined management consulting services firm that regularly intends to seek business, or currently may be undertaking business, with companies covered on Oil & Gas 360®, and thereby seeks to receive compensation from these companies for its services. In addition, EnerCom, or its principals or employees, may have an economic interest in any of these companies. As a result, readers of EnerCom’s Oil & Gas 360® should be aware that the firm may have a conflict of interest that could affect the objectivity of this note. The company or companies covered in this note did not review the note prior to publication.