Seems like just yesterday it was Q4 reporting season. But time flies—quarter by quarter—in the public company universe.
EnerCom, Inc. has compiled first quarter earnings per share, revenue, EBITDA and cash flow per share analyst consensus estimates on 112 E&P and 82 Oilfield Service companies in the EnerCom database.
Download EnerCom’s full chart of estimates.
The median OilServices company earnings estimate for the quarter ending March 31, 2018, is ($0.04) per share compared to a loss per share of ($0.07) and ($0.02), for Q4’17 and Q3’17, respectively. The median E&P company earnings estimate for the quarter ending March 31, 2018, is $0.13 per share compared to actual earnings per share of $0.06 and a loss of ($0.03) for Q4’17 and Q3’17, respectively.
Energy Commodities
Crude Oil
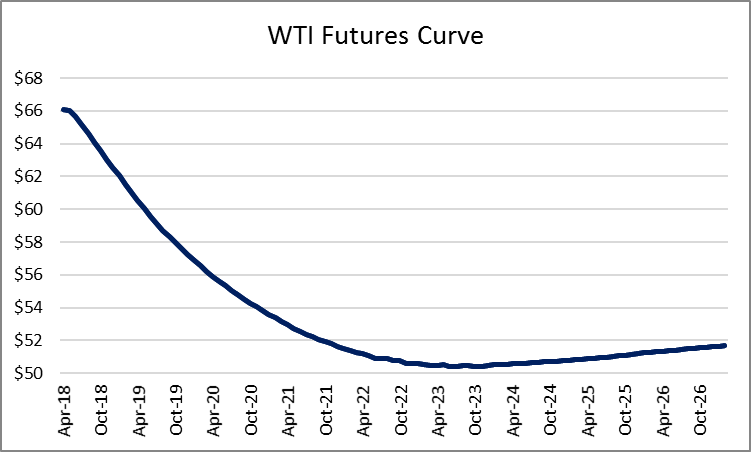
U.S. oil consumption in January 2018 was 20.5 MMBOPD, up 1.9% from the previous month and up 6.4% from the same month in 2017. For January 2018, U.S. crude oil production was 10.0 MMBOPD, flat from December production and up 12.9% from a year ago. The average spot price for WTI in March 2018 was $62.72 per barrel, up 0.8% from the prior month and up 19.5% from the same month last year. The five-year strip at April 17, 2018 was $50.56 per barrel.
The median analyst estimate at the beginning of April for 2018 NYMEX oil was $61.00 per barrel with a high of $67.00 and a low of $54.00 per barrel.
Natural Gas
For January 2018, total natural gas consumption was 107.0 Bcf/d, up 8.1% from the month prior and 14.4% higher than the same month last year. Total natural gas production in January 2018 was 77.4 Bcf/d, down 1.2% from the month prior and up 9.6% from the same month last year.
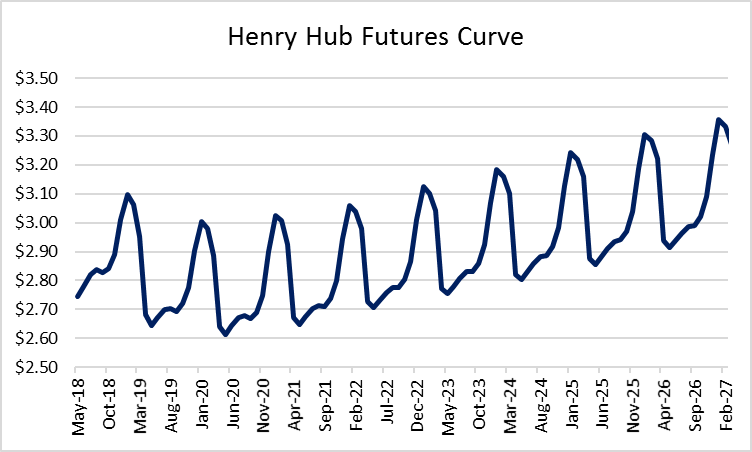
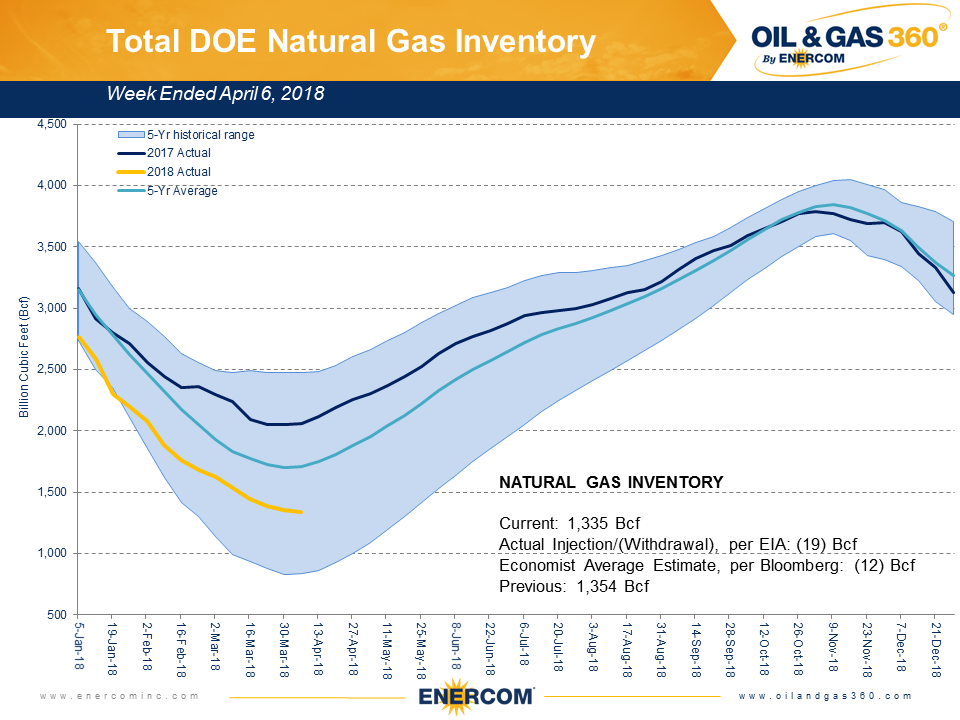
At 1.3 Tcf (week ending 4/6/18), natural gas storage was 21.9% below the five-year historical average, and 46.1% below the five-year high. The average spot price for Henry Hub in March 2018, was $2.81 per MMBtu, 6.6% than the previous month and 21.7% lower than in March of last year. The five-year strip at April 17, 2018 was $2.77 per MMBtu.
The median analyst estimate at the beginning of April for 2018 NYMEX Henry Hub was $2.99 per MMBtu with a high of $3.33 and a low of $2.75 per MMBtu.
Rig Count – U.S. Rig Count Increases
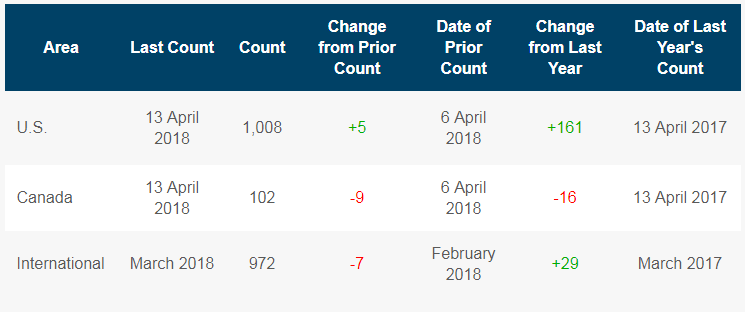
The U.S. rig count stood at 1,008 for the week ended April 13, 2018, up 5 from the week ended April 6, 2018, and an increase of 161 from the same week last year.
For the week ended April 13, 2018, there were 883 horizontal rigs active in the United States, an increase of 25.1% from the same week a year ago. By play and as compared to the same week last year, rig count changes for the week ended April 13, 2018, include Haynesville (+15 rigs), Fayetteville Shale (unchanged), Woodford Shale (+10 rigs), Appalachian Basin (+12 rigs), Williston Basin (+12 rigs), Eagle Ford Shale (unchanged), DJ Niobrara (unchanged) and Permian Basin (+106 rigs).
Equity Markets
From EnerCom’s E&P Database: For April 13, 2018, year-to-date large-cap, mid-cap, small-cap and micro-cap E&P stocks changed by 2%, -2%, -4% and 6%, respectively. Year-to-date, oil-weighted and gas-weighted companies moved 3.5% and -20.0%, respectively.
By region as of April 13, 2018, year-to-date, Bakken, Midcontinent, Marcellus, Gulf of Mexico, Canada, and Diversified stocks changed by 13%, -6%, -12%, -8%, -12%, and 4% respectively.
From EnerCom’s Oil Service’s Database: As of April 13, 2018, year-to-date, OilService’s large-cap and mid-cap stocks changed by -1%, -6%, respectively, while small-cap and micro-cap stocks changed by 1%, and -4% respectively.
Expected Themes for Conference Calls
Below are some themes and thoughts we expect to take prominence on this quarter’s conference calls.
E&P Companies:
- Activity levels in light of current oil prices
- Returning cash to shareholders
- Full cycle returns
- Potential for M&A activity
- Consolidation possibilities
- Liquidity, capital market funding and debt maturities
- Size of drilling inventory
- Transitioning into development mode
- Service cost inflation
- Completions availability
- Hedge position
- Operating efficiencies
- Gas takeaway
OilService companies:
- Global economic outlook
- U.S. vs international activity
- Service disruptions
- Rig count projections
- Pricing trends
- Oilfield service equipment utilization rates and the potential for added capacity
- Service cost inflation
- Margin trends
- Equipment newbuild potential
- Availability of experienced crews
- Infrastructure buildout and bottlenecks (particularly water and sand)
- Potential impacts of sanctions and changing trade relationships


