The EIA today released data on the main energy producing industries in the U.S, and its predictions for 2019.
Commodities pricing
In July 2018, Brent crude oil spot prices averaged $74 per barrel (b), which is largely unchanged from the average in June. EIA expects Brent spot prices will average $72/b in 2018 and $71/b in 2019. EIA also expects West Texas Intermediate (WTI) crude oil prices will average about $6/b lower than Brent prices in 2018 and in 2019. NYMEX WTI futures and options contract values for November 2018 delivery that traded during the five-day period ending August 2, 2018, suggest a range of $54/b to $84/b encompasses the market expectation for November WTI prices at the 95% confidence level. Based on this information the EIA estimates that U.S. crude oil production averaged 10.8 million barrels per day (b/d) in July, up 47,000 b/d from June. EIA forecasts that U.S. crude oil production will average 10.7 million b/d in 2018, up from 9.4 million b/d in 2017, and will average 11.7 million b/d in 2019.

Inventory
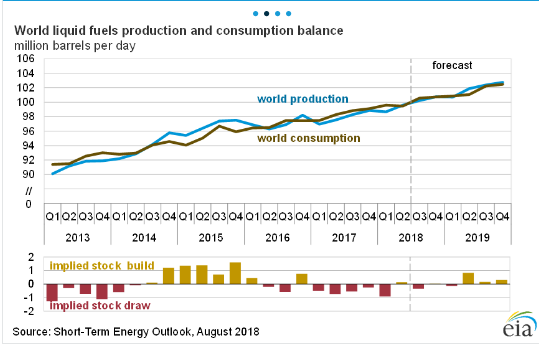
EIA forecasts total global liquid fuels inventories to decrease by 0.3 million b/d in 2018 compared with 2017, followed by an increase of 0.3 million b/d in 2019. This outlook of relatively stable inventory levels over the forecast period contributes to a forecast of monthly average Brent crude oil prices remaining relatively stable between $70/b and $73/b, from August 2018 through the end of 2019.
Natural gas Production
Dry natural gas production was 81.8 billion cubic feet per day (Bcf/d) in July, up 0.4 Bcf/d from June. EIA forecasts dry natural gas production will average 81.1 Bcf/d in 2018, up by 7.5 Bcf/d from 2017 and establishing a new record high. It is expected that natural gas production will rise again in 2019 to 84.1 Bcf/d.
Pipeline exports of natural gas
Overall pipeline exports of natural gas, which averaged 6.7 Bcf/d in 2017, will average 7.0 Bcf/d in 2018 and 8.5 Bcf/d in 2019. Increasing natural gas production in the United States and the completion of new pipelines that carry U.S. natural gas to demand centers in Mexico contribute to the expected increase. In June, two new pipelines in Mexico were placed in service that will distribute natural gas from the United States to destinations in Mexico. In addition, EIA forecasts exports of liquefied natural gas (LNG) rise from 1.9 Bcf/d in 2017 to 3.0 Bcf/d in 2018 and to 5.1 Bcf/d in 2019. This growth contributes to U.S. net exports of natural gas averaging 2.0 Bcf/d in 2018 and 5.4 Bcf/d in 2019, compared with 0.3 Bcf/d in 2017.
Gas prices
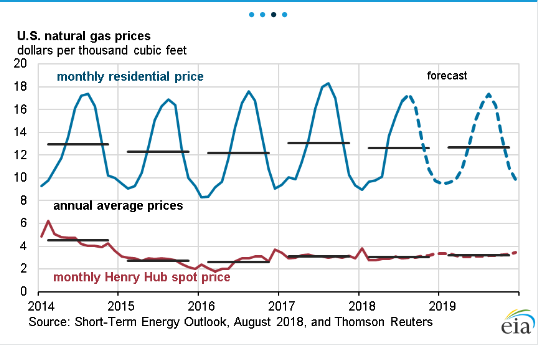
EIA expects Henry Hub natural gas spot prices to average $2.96/million British thermal units (MMBtu) in 2018 and $3.10/MMBtu in 2019. NYMEX futures and options contract values for November 2018 delivery that traded during the five-day period ending August 2, 2018, suggest a range of $2.33/MMBtu to $3.48/MMBtu encompasses the market expectation for November Henry Hub natural gas prices at the 95% confidence level. EIA expects the share of U.S. total utility-scale electricity generation from natural gas-fired power plants to rise from 32% in 2017 to 34% in 2018 and to 35% in 2019.
Coal
EIA forecasts coal production will decline by 1.1% to 766 million short tons (MMst) in 2018 despite a 5.7% (6 MMst) increase in coal exports. The production decrease is largely attributable to a forecast decline of 2.1% (15 MMst) in domestic coal consumption in 2018. EIA expects coal production to decline by 1.8% (14 MMst) in 2019 because coal exports and coal consumption are both forecast to decrease.
Emissions
After declining by 0.9% in 2017, EIA forecasts that energy-related carbon dioxide (CO2) emissions will rise by 2.0% in 2018. The increase largely reflects higher natural gas consumption because of a colder winter and warmer summer than in 2017. Emissions are forecast to decline by 0.8% in 2019. Energy-related CO2 emissions are sensitive to changes in weather, economic growth, energy prices, and fuel mix.
Oil & Gas 360 contacted the EIA for clarification on its emissions projections. “The CO2 values are a result of overall energy demand and the fuel mix to meet that demand,” Perry Lindstrom, senior energy/ environmental analyst for EIA told Oil & Gas 360 via email.
“Weather plays a big role in year-to-year changes. We are projecting an increase for 2018 largely because of unfavorable weather compared to 2017. Coming off of 2018 then weather is forecast to be a bit more favorable. Also natural gas prices are projected to increase only modestly and renewable energy continues to increase—the result is that coal CO2 emissions decline by 60 million metric tons and that is not fully offset by increased petroleum emissions,” Lindstrom said.
Electricity Generation
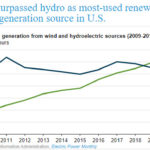
EIA’s forecast electricity generation share from coal averages 28% in 2018 and 27% in 2019, down from 30% in 2017. The nuclear share of generation was 20% in 2017 and is forecast to be 20% in 2018 and then fall to 19% in 2019. Nonhydropower renewables provided slightly less than 10% of electricity generation in 2017 and EIA expects it to provide more than 10% in 2018 and nearly 11% in 2019. The generation share of hydropower was 7% in 2017 and is forecast to be about the same in 2018 and 2019.
Short-Term Energy Outlook available here